Japan’s Triple-Threat Crisis Interactive Map

After attending the inter-disciplinary presentation on Japan after one year of the triply devastating earthquake, tsunami and nuclear power events, I wanted to do more research on the events of the day March 11, 2011. The chain of events were extremely well documented, and can be found on many websites and blogs, such as the Huffington Post. I found an interactive map from CNN that shows the countrywide impact of the tsunami, earthquake and nuclear power plant failures.

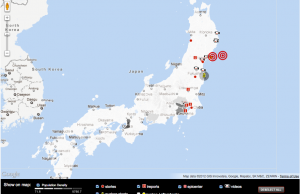
Map of Japan after 2011 Earthquake

The interactive map allows the user to manipulate settings between broad categories of events on March 11, as well as casualties and damages caused. One can see that the epicenter of the 9.0 earthquake was located extremely close to the northeastern coast of Japan, in addition to the recorded 13 aftershock earthquakes that were measured to posses almost as much energy as the original 9.0 earthquake. The most casualties (over 19,000 total) were along the northeastern coast of Japan, but casualties were observed throughout the country. The worst damage was found along the entire northern land of Japan. After the events of March 11, 2011, Japan lost over $44 billion in infrastructure.

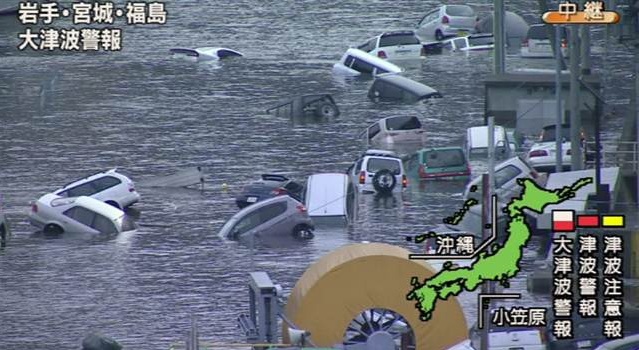
Cars Floating in Japan after Tsunami

The nuclear power plant near Minamisoma video shows utter destruction of the city, where panic grew even more after discovering the possibility of  nuclear power plant failure. Many people were displaced due to the earthquake, tsunami, and radioactive zone around the 54 nuclear power plants in Japan. Currently, there are two power plants that are being used for Japanese power and electricity, but by this summer there will be no usable nuclear power plants in Japan. This creates a large economic and political problem for Japan, where there is an apparent shortage of power and electricity in a highly industrialized country. Adding to the problem, Japan is not a naturally resource-rich country: it must import the fossil fuels to make up for the loss of nuclear power (what used to be 30% of the country’s power generation). It is probable that Japan will resort to importing  high amounts of fossil fuels (such as coal, oil and natural gas) as power to stabilize the country in the near future.

Japan is on its way to recovery and reconstruction after a devastatingly large earthquake, tsunami and threat of nuclear power plant meltdown, and it will be interesting to watch what Japan must do to remain a large worldpower.

Website: http://www.cnn.com/SPECIALS/2011/japan.quake/map/

James River Report Card 2011

In doing research on the James River in conjunction with our lab and class discussion, I came upon an interesting and relevant report on the current state of the James River. The pdf attached here shows a detailed account of how the James River is doing today, in comparison with recent years and the history since environmental records have been recorded.

The report gives the current state of the river a C overall, a score lower than I anticipated. After our walk around Belle Isle, it seemed like the James was in pretty good shape, but the evidence shows there is significant room for improvement in some areas. In terms of wildlife, the report card confirms that the population of small-mouthed bass has improved, but is still only at about half of the population goal. Another successful area of wildlife in the river system is the bald eagle, which has reached its goal for a healthy population.

The river scored a B- in Habitat, its highest scoring section. While the river has seen improvements overall in the long term, in the short term it is obvious that it still struggles from too many nutrients and sediments, which is leading to abundant algae and poor water clarity. Richmond needs to invest more money in the protection of runoff in order to improve the score for this section.

With regard to pollution and plans for restoration, the river scored a C in both categories. The levels of nitrogen and sediments in the river are still unsustainably high. The city works to protect the area of the river and improve the riparian zones around the river, but more needs to be done in order to bring the James River to the set level of cleanliness.

Questions to think about:

What is a realistic goal for improvement in the river for next year? Which area of the river should Richmond focus on improving? How could efforts be increased? How could awareness in the community and surrounding areas be increased?

Check out the report card here! State of the James River 2011

Source: http://www.jamesriverassociation.org/the-james-river/state-of-the-james/


“My Environment” Interactive Map

If you are wondering how Richmond compares to other parts of the country in terms of water and energy usage, head to the “My Environment” tool on the EPA website. It allows users to search for cities nationwide, displays a map with local sources of air, water, and land pollution.  As geography students, this tool allows us to apply concepts we are learning about water, the atmosphere, and environmental processes to local spaces.  The icon for each source reveals the name and address of each potential source of pollutants:

The site also compares local energy production to local energy consumption in terms of coal,natural gas, petroleum, and other sources of energy. Both Virginia and my home state of North Carolina consume more petroleum than any other energy source. While according to the data NC only produces nuclear energy, VA produces coal, natural gas, nuclear, and renewable energy. Data contained on the page is time sensitive, and users can even find out the daily air quality at their location. On the day of this post, my hometown was experiencing the most air pollution from particulate matter, while Richmond’s air was most polluted by carbon monoxide.

The site also encourages community interaction, and contains a “My Community” link where users can report on positive changes being make for the environment. Though the Richmond page does not currently have any news showing, we already know from our geography class that the city of Richmond and the University of Richmond are sensitive to protecting our natural resources.

Auroras: How they work and how to see one!

Aurora Borealis


Auroras are something I have always heard about, but I have never been sure of what they are exactly. We have all seen the pictures of the beautiful green, red, and blue lights in the sky, but I would bet that few of us have ever seen one in person. The National Oceanic and Atmospheric Administration website says that there is almost always at least a small aurora somewhere in the sky, but they are generally difficult to see. This is because they are most common in the far northern and southern latitudes. In the north, the best locations tend to be Canada, Alaska, Northern Greenland, Scandinavia, and Siberia for seeing auroras. Also, the best time to see an aurora is in the middle of winter between 10:00 p.m. and 2:00 a.m.

The northern and southern versions of auroras were first named in 1621 by a French Scientist named Pierre Cassendi. The northern lights, or Aurora Borealis, were named after the Roman goddess of dawn (Aurora) and the Roman god of the north wind (Boreas). The southern auroras are named Aurora Australis for “southern dawn.”

The formation of Auroras begins on the Sun 93 million miles away and ends 60 to 600 miles above Earth’s surface. The Sun sometimes emits highly charged protons and electrons. This solar wind then energizes protons and electrons within Earth’s magnetic field, which travel down magnetic field lines to Earth’s atmosphere near the poles. These charged particles then excite atmospheric gas atoms and molecules. As they relax back down to their normal state, the molecules and atoms release the energy as visible light, which we see as auroras.

The National Oceanic and Atmospheric Administration (NOAA) keeps track of these solar storms that can lead to auroras. Strong storms can cause trouble with satellites, power grids, GPS signals, communication technology, and even astronaut safety. Luckily for us, it also means that they monitor where and when auroras occur on Earth. You can visit the Space Weather Prediction Center’s Aurora website to see the current auroras. If you happen to be far north and there is a strong storm, maybe you’ll get a chance to see one. I hope I do someday!

Aurora Australis

Maps can show the world…as it really is

 Maps are boring, right? But you’ve never seen maps like this before, ones that can animate the increasing world’s population. Globalization, migration, poverty, diseases, all in the map above. Countries in the world  grow or shrink over time depending on what parts of the are population hot spots. The shows the world’s population from 1950 to 2100 (using estimates from the UN). The population around 2100 is expected to level out around 10 billion people, according to UN estimates.

The map animation is made using an algorithm that distorts the map to display where most of the people in the world actually are.IT really puts into perspective different global events, and uses maps in ways people have never imagined.Dr. Benjamin D. Hennig at the University of Sheffield created this animation using animations from a website called World Mapper (www.worldmapper.org)

World Mapper distorts the traditional world map to display things like world leaders in car exports, cases of malaria, CO2 emissions, and plenty more. Check out the different ones they have, here.  Worldmapper has been used different university studies and by presenters who want to their audience a sense for how the world is on a map, in relation to a specific issue. Here is an animation, for example, of the world’s countries that emitted CO2 between 2006 and 2009 (on right).

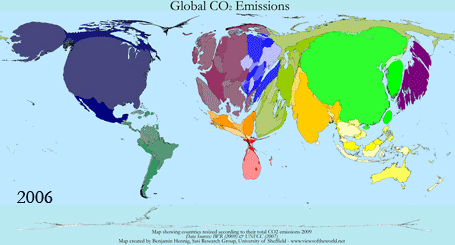
You can gauge just from looking at it, which countries are the biggest and smallest in the world. Notice how the United States, China, India, and most of Europe are emitted heavily.

You can also see a slight shift in CO2 emissions on the left side of the world that suggests decreased emissions. China and most of Asia increase their emissions.

Check out more maps on World Mapper. Get educated…while being interested.


Global Volcanism Project

http://www.volcano.si.edu/index.cfm

Call it the inner child, but I have always had a fascination with things that go “BOOM!” Of course, when we began to learn about volcanoes in class, my ears perked up and I looked forward to finding out about their development and the predictability of their eruptions.

This site, sponsored by the Smithsonian creates a world-wide map of all the volcanoes, but above water and under water and gives significant information about their most recent explosions, their size, their history, etc. They even have interactive maps in which you can click on any volcano in the world and find out just about everything known up to date.

It was also interesting to find out that most volcanoes don’t have the resources and funding available to predict the future eruptions and monitor the seismic activity. It takes a lot of money and apparently we don’t have enough funding to keep track of every volcano. Clearly this means there is a lot of danger for anyone around an unmonitored volcano at any time.

The site provides information on literally everything you might need to know about volcanoes but it also admits the things we do not know about volcanoes and unpredictability that is associated with them. This is a great resource for anyone interested in volcanic activity across the world as it is constantly updated with new peer-reviewed articles about eruptions and predictions. I would suggest this to any curious GIS-er or civilian scientist looking for volcanic information..


-Patrick Jones

Australia announces world’s largest MPA

http://www.treehugger.com/ocean-conservation/australia-proposes-creation-of-worlds-largest-marine-reserve-in-coral-sea.html


This past Tuesday, Australia announced its proposal of the largest ever Marine Protected Area. The park will encompass 999,000 square kilometers (roughly 380,000 square miles) of the Coral Sea near Papua New Guinea. Possibly the most interesting aspect of this designation is that over 500,000 square kilometers will be allocated as “No Take Areas” where no fishing of any sort is allowed.  This leaves roughly 500,000 square kilometers where fishing and recreation will be heavily regulated. Many environmentalists are outraged calling for a greater proportion of the MPA to be a No Take Area, but the government is trying to balance the interests of their fishing industry as well. The environmentalists stress that No Take areas are crucial in keeping many species from becoming endangered, as they represent their feeding and breeding grounds.

            The site is part of Australia’s larger effort to make all of their waters protected. What might be more accurate is saying that Australia plans to heavily regulate all of their waters, considering the absence of No Take Areas. Yet the government is determined to protect and uphold the many treasures that can be found in the waters off its Coast. The MPA proposed has 20 isolate reefs, deep sea plains and canyons, as well as spectacular biodiversity.

Overall, while this park is clearly a step in  the right direction for protecting marine and aquatic life there is the overall feeling that more could be done, but because of our reliance on fisheries it has become an interesting predicament for governments to handle.


Global Warming Happening A lot Faster Than You Think


http://www.treehugger.com/climate-change/world-track-11-degree-rise.html

This article talks about the prediction of scientists that the Earth’s average temperature will increase by 11 degrees farenheit by 2100. While all of us will be long gone by then, we will feel the changes gradually. The IEA, International Energy Agency, is responsible for this new prediction in global temperatures.

The IEA believes that human activity is responsible for this change with the burning of fossil fuels releasing greenhouse gases into the atmosphere. They believe that unless we are able to curb our consumption of fossil fuels, the Earth is in store for a “spell catastrophe”. The use of electric powered machines and an increase in the reliance in other forms of renewable energy will enable us to avoid some of this 11 degree increase.

The author blames the Republican party for the inexistence of a global climate treaty. Because they vehemently deny global warming, the United States does not stand a united front against global warming. The United States, being a leading nation, has the power to influence smaller countries in acknowledging this problem. Unless the world is able to come together in order to solve global warming, we will witness drastic climate changes in the next 100 years.

Farm Fountain

Based in a system of aquaponics, the Farm Fountain presents a unique combination of art and science. It is a system that grows edible plants and fish indoors in an aesthetically pleasing and sustainable manner. The way that it works is the waste filled water from a fish tank is pumped up to the top of the structure and then filtered back down through several 2-liter bottles with edible plants growing in them. The plants then absorb the water and nutrients from the fish waste and the excess water then trickles down back into the fish tank where the process starts over again.


Some of the examples of farm fountain structures can be seen on the farm fountain website. In these examples the structures are used to grow lettuce, cilantro, mint, basil, tomatoes, chives, parsley, and many other garden herbs and vegetables. The fish tank can include fish like tilapia, which can be eaten along with the vegetables. The system offers a great way to grow your own food at home in a cool and sustainable manner. The structures can be set up to use solar power to power the grow lights so that the entire process is sustainable.


This concept applies to our course because earlier in the year we discussed the concept of virtual water and how far food travels before it reaches your plate. With the farm fountain all of your food can be grown right at home. This site gives instructions on how to build your own farm fountain and offers suggestions on what vegetables to grow.