Gap Analysis Program (GAP) Protected Areas and Land Cover Data Viewer

This geographic website is for the Gap Analysis Program (GAP) Viewer of the USGS for Protected Areas and Land Cover Data.

Separated into two different viewers for user clarity, the viewers provide users ranging from the public to professional land managers a spatially explicit inventory of the Protected Areas of the United States and a consistent nation-wide inventory of vegetation and land-use patterns for the United States.

This compilation of data types for the Gap Analysis Program is being served by the United States Geological Survey for aid in conservation, land management, planning, and recreation, amongst other uses.  In order to increase collective knowledge, these interactive maps are designed to disseminate up to date, concise, and specific data to facilitate the planning and management of biological diversity on a local, regional, and national scale.

Data viewers like these can be exceptionally helpful to both grab data and see data without the need to use any local semblance of a Geographical Information System.  In accordance with our national park projects and our final projects, I could see these viewers becoming exceedingly helpful in data gathering and analysis.  I encourage you to check them out and see how you can utilize them!

PAD: https://maps.usgs.gov/padus/

LCD: https://maps.usgs.gov/padus/

Brilliantmaps: Making Sense Of The World, One Map At A Time

Have you every thought about how many times Scotland’s population could fit inside England, or wondered how many countries have been affected by the current ‘Panama Papers’ scandal, or maybe imagined how the world would look in Harry Potter’s eyes? Maybe? O.k. maybe you’re not that curious…. But we have all scoured the internet to find the perfect map to explain a certain phenomena in our research papers and powerpoint presentations. Well…Brilliantmaps is here for you! Brilliantmaps is the holy grail of maps!

Even if you are not obsessed with cartography, Brilliantmaps has something for everyone. The site regularly updates its content with interactive maps covering everything from current developments such as the Syrian Refugee Crisis to classic maps showing European’s view of the world in the beginning of the colonial era. For the true map lovers out there, the site ups the ante, allowing users to use scratch map templates to create their own maps and showcase it to the world. There is also a list of recommended board games that breathe a breath of fresh air into map making. Have a mentioned the Facebook page? And the newsletter? Brilliantmaps is brilliant because it provides a framework for integrating maps into our everyday life.

Check out some of my favorite maps below and don’t forget to take a look at the thousands of maps available on the website: http://brilliantmaps.com/

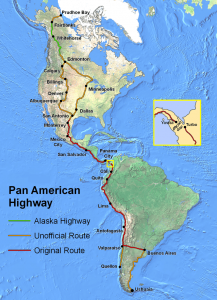
The Pan American Highway

PanAmericanHwy

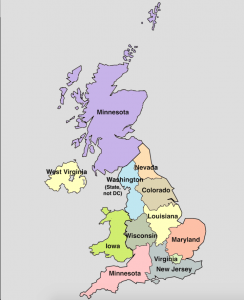
UK regions compared to US States

UK-regions-compared-to-US-States

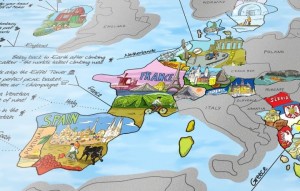
The Travel Bucket List

Bucket-List-World-Map-Scratch-Edition

Go get your map on! You will be surprised at the power of mapping!

Cheers.

Javanni.


Maps can show the world…as it really is

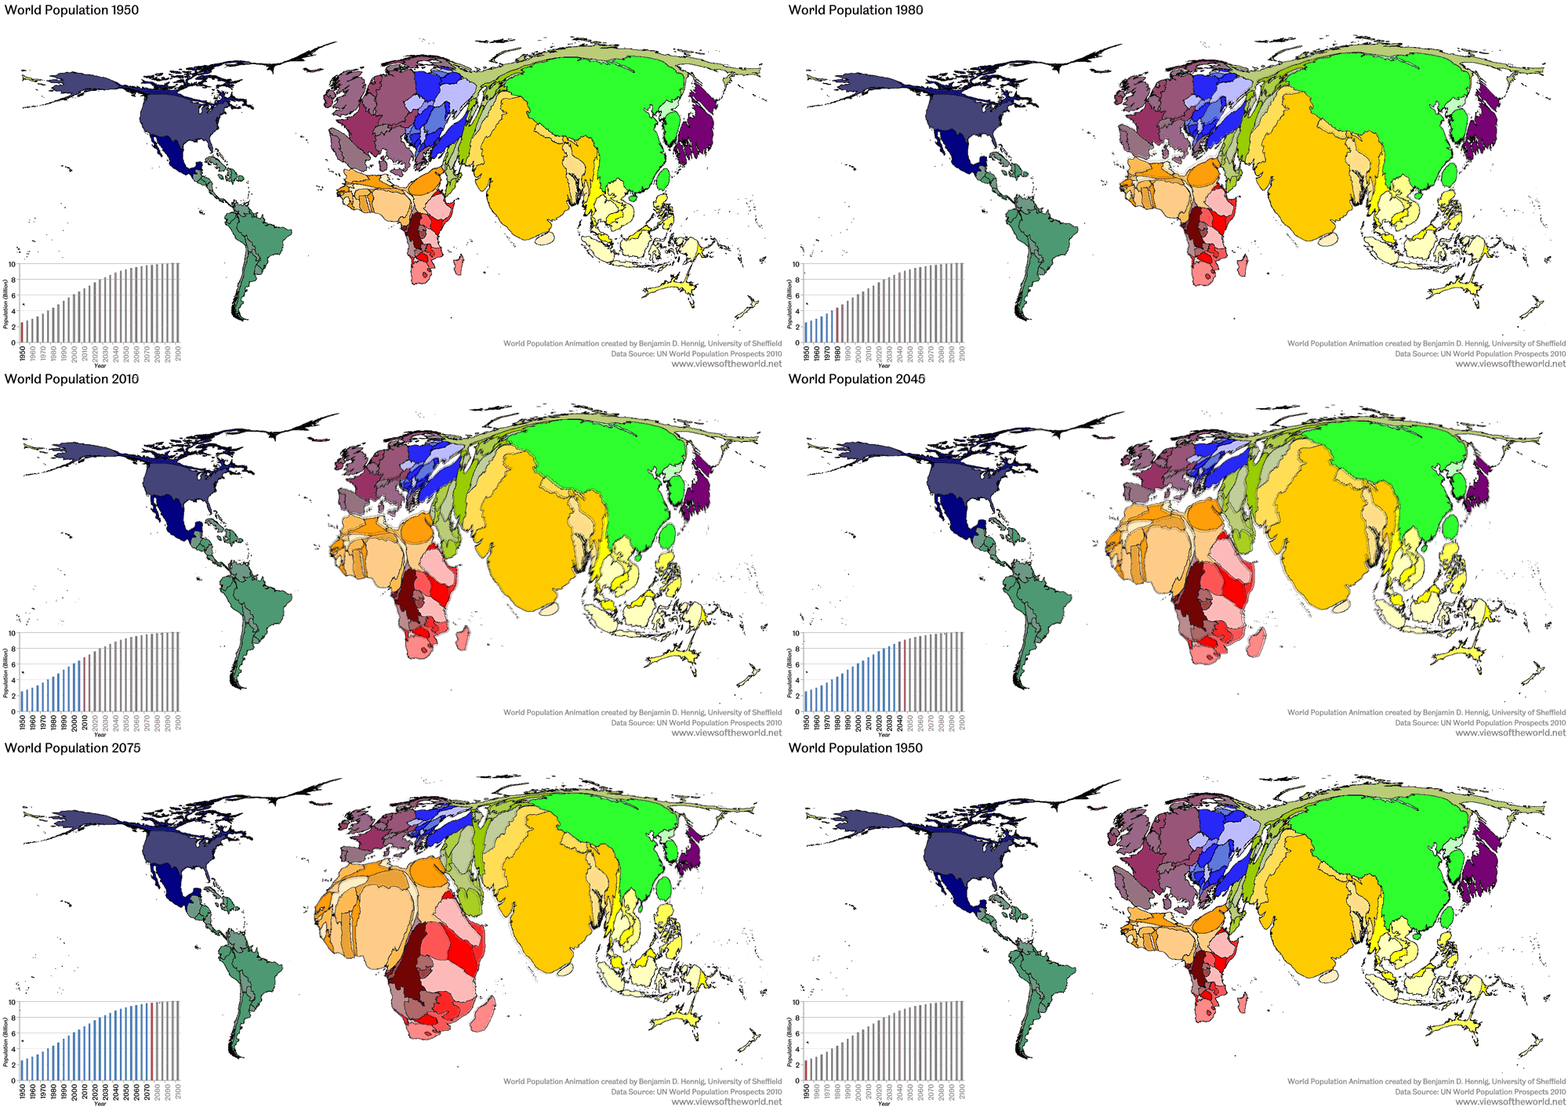
 Maps are boring, right? But you’ve never seen maps like this before, ones that can animate the increasing world’s population. Globalization, migration, poverty, diseases, all in the map above. Countries in the world  grow or shrink over time depending on what parts of the are population hot spots. The shows the world’s population from 1950 to 2100 (using estimates from the UN). The population around 2100 is expected to level out around 10 billion people, according to UN estimates.

The map animation is made using an algorithm that distorts the map to display where most of the people in the world actually are.IT really puts into perspective different global events, and uses maps in ways people have never imagined.Dr. Benjamin D. Hennig at the University of Sheffield created this animation using animations from a website called World Mapper (www.worldmapper.org)

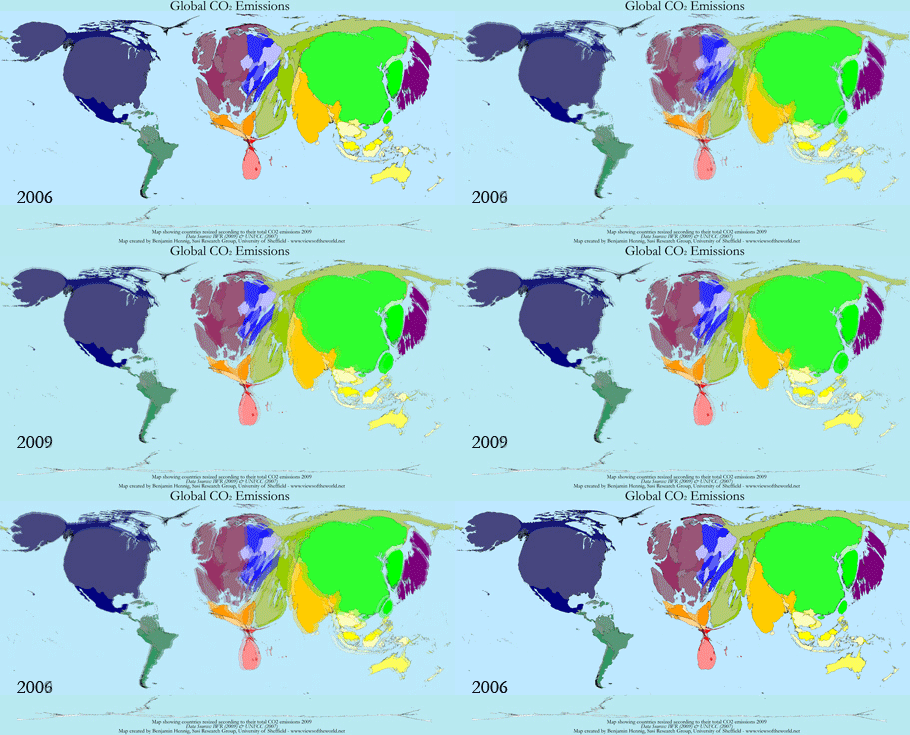
World Mapper distorts the traditional world map to display things like world leaders in car exports, cases of malaria, CO2 emissions, and plenty more. Check out the different ones they have, here.  Worldmapper has been used different university studies and by presenters who want to their audience a sense for how the world is on a map, in relation to a specific issue. Here is an animation, for example, of the world’s countries that emitted CO2 between 2006 and 2009 (on right).

You can gauge just from looking at it, which countries are the biggest and smallest in the world. Notice how the United States, China, India, and most of Europe are emitted heavily.

You can also see a slight shift in CO2 emissions on the left side of the world that suggests decreased emissions. China and most of Asia increase their emissions.

Check out more maps on World Mapper. Get educated…while being interested.