The Hidden Water We Use

The National Geographic website has several interactive activities, but one that I found particularly interesting was titled “The Hidden Water We Use,” which describes the amount of water embedded in objects we use everyday.  It describes how much water is used in each step of production of things like food and energy.

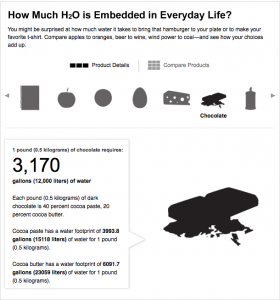
One that I found very surprising was the water used in producing 1 pound of chocolate – which I happen to eat a lot of! To make 1 pound of dark chocolate, 3,170 gallons of water are used. (3,993.8 gallons goes into making of 1 pound cocoa paste, and 6,091.7 gallons go into making 1 pound of cocoa butter!)


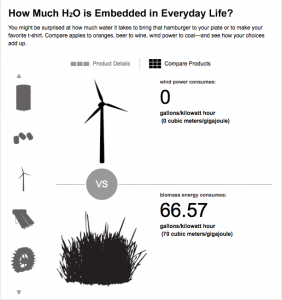
Another interesting part of this website was comparing products.  I compared wind energy and biomass energy and found that wind energy consumes no water, while biomass energy consumes 66.57 gallons of water per kilowatt hour.  Also interesting was that hydropower consumes 20.92 gallons of water per kilowatt hour and oil consumes 1.01 gallons of water per kilowatt hour.

There were also a few fun quizzes that I found, and realized I learned a lot of the information from class.  Try them out and see how well you can do!
.
http://environment.nationalgeographic.com/environment/freshwater/embedded-water/

Breathing Earth—A Simulation of CO2 Emissions, Birthrates, and Death Rates

This website offers viewers an interesting and interactive way to conceptualize global CO2 emissions, as well as the birth and death rates of different geographical locations. The simulation uses statistical data for these different rates to provide general information about worldwide trends. The changing colors and the flashing dots and symbols explained in the key allow you to absorb the areas of highest CO2 emissions, as well as the highest birth and death rates by simply watching the map. As this simulation is interactive, you can also place your cursor on areas of the world that interest you to learn more about their specific rates. In the U.S., for example, one person dies every 12.1 seconds, one person is born every 7.4 seconds, and 1000 tons of CO2 are emitted every 5.3 seconds. If you click on a country, a box pops up suggesting useful climate change websites for that particular country, and on the bottom righthand side of the page, there is a box that shows how many tons, births, and deaths have occurred while you’ve been on the page.

Though we often hear or read statistics about increasing population and dangerous levels of CO2 emissions, this website applies these statistics to a world map, and thus allows us to visualize the areas in which these rates are the most problematic. By poking around on this page, I not only feel that I gained a slightly better sense of the the way these trends play out on a global scale, but I also found several other interesting websites about climate change that are specific to certain countries or areas of the world.

www.breathingearth.net

Envision the James GeoStories

The Envision the James project is an online initiative to engage the community to make their voices heard pertaining to the James River. The project seeks to educate people but also learn what they would like to see happen along the James in terms of recreation, protection, and education. This is very important to helping people understand the geography of the James River and how it affects and is affected by humans.

The site also includes GeoStories, which are collections of pictures, videos, text, and audio that tell a story about a place. Several are already available on the website discussing several different areas along the James River. This is a great way to “remote sense” the river and learn more about it through other people’s experiences.

http://www.envisionthejames.org/about

The Ten Most Spectacular Geologic Sites

After learning about the pedosphere/lithosphere in class. I was extremely interested in the rock cycle and how various rocks were created. After the last exam, I know you all are familiar with the three main types of rocks and how they can form from one another. After studying, I wanted to do a little bit more research on interested geologic features on the Earth’s surface. I came across this website, which I found to be extremely fascinating! You all should check out these pictures.

See if you can recognize a few of these geologic sites that we mentioned in class!

Enjoy


http://www.smithsonianmag.com/science-nature/The-Ten-Most-Spectacular-Geologic-Sites.html?c=y&page=1

National Geographic Global Water Footprint

National Geographic Global Water Footprint

This website is an interactive way to check your water footprint based upon what you consume. It shows where it comes from and how much water comes from certain areas for certain products. On this website you can also look at locations such as the Mississippi River Basin and see how much water is used and for what product in those areas.

This website allows us to understand and be aware of how much of the Earth’s water is being used for each of the common products we use every day such as coffee, corn, barley, cotton, grapes, cocoa, etc. It is important to understand how we are using our water and where that water is coming from. This is especially important because we know that less than 0.3% of our water on the earth is unfrozen fresh water. If we are unaware of how much is being used for the crops we produce and consume, it is possible that we could deplete these water sources quicker than we should be.

(From Kate Desai)

Earth and Moon Viewer

The Earth and Moon Viewer allows visitors to view either a real-time map of the Earth showing day and night regions, or view the Earth from the Sun, the Moon, the night side of the Earth, above any location on the planet that is specified by latitude, longitude, and altitude, from a satellite in Earth’s orbit, or above various cities around the globe.

There are many different viewing options of the Earth, which can be generated based on either a full-color image of the Earth by day and night, a topographical map of the Earth, up-to-date weather satellite imagery, a composite image of cloud cover superimposed on a map of the Earth, and several other features.

In addition to viewing the Earth, visitors can choose to view images of the Moon from the Earth, Sun, night side, or as a map showing day and night.

This website is really cool if you want to take a real-time look at all parts of the world and our moon as they constantly change!

http://www.fourmilab.ch/earthview/vplanet.html 

DataBasin: science-based mapping and analysis platform


Data Basin is a web-based GIS tool that pulls from scientific data to create and online mapping tool to be used in analysis.. Data Basin supports learning, research, and sustainable environmental stewardship. Data Basin has three main thematic areas: climate, protected areas, and global forests.

Data Basin also provides a network for the communication and sharing between spatially-minded peoples. It can be an integral tool in that it allows anyone to publish maps, data sets, and aids in decision making.

http://databasin.org/

Water Cycle Activities

Image

The hydrosphere consists of the transformation and transportation of water throughout Earth’s spheres. This interactive site aims to challenge visitors on the stages of the water cycle. Then it explains the stages of the cycle which include evaporation, cloud formation, precipitation and water collection. All of these processes require the heat of the sun. This website would serve as a good studying tool for the hydrosphere.

http://player.discoveryeducation.com/views/hhView.cfm?guidAssetId=087777c8-4ff0-45d2-878f-e7cd90f7ee19

Forces of Nature

On the National Geographic website, I found an interactive and informative activity called Forces of Nature. Not only can you read up on tornadoes, volcanoes, hurricanes, and earthquakes, watch videos, view pictures, and learn about different case studies, but you can also improve your knowledge by causing a tornado, building a volcano, spinning off a hurricane, and setting off an earthquake. For example, to trigger an earthquake, you choose the ground type (bedrock, landfill, fault zone) that the building stands on, and the magnitude (low, high) of the earthquake, set it off, and see how the building responds to the earthquake. If a high magnitude earthquake occurs on a fault zone, for example, there will be significant displacement—sometimes the building may collapse partially or entirely. This earthquake activity in particular reminded me of our discussion in class about the Mercalli Scale that measures the damage the earthquake does. Check out all the Forces of Nature and play around with the conditions to create either a moderate or deadly disturbance.

http://environment.nationalgeographic.com/environment/natural-disasters/forces-of-nature/

Sea Temperature Rise

Rising sea temperatures is a great concern for our planet in the future. Although the ocean temperature does not warm or cool as dramatically as the land the ocean temperature has increased 0.18 Fahrenheit. This temperature increase may not seem severe but it has caused smaller organisms like krill to decrease in reproduction and has also caused coral to bleach, slowing their growing and making them susceptible to disease. The slow reproduction of krill causes a food shortage for many organisms that feed on them. The rising sea temperatures have also caused stronger storms. The warmer water temperatures create more water vapor, making it easier for storms to increase their size and intensity as they move over the warmer waters. In order to slow rising ocean temperatures we need to dramatically decrease our greenhouse gas emissions. Even if our carbon dioxide emissions level dropped to zero, the gases already present in the atmosphere would take decades before declining. This is a concerning problem that our generation will have to solve for our world to continue to function properly.