National Marine Protected Areas Center

http://marineprotectedareas.noaa.gov/

Recently in class we have been discussing the various opinions on the use of Marine Protected Areas to conserve the Ocean’s Biodiversity. This website is provided by the National Oceanic and Atmospheric Administration, and serves as a resource for students, researchers and the general public to understand Marine Protected Area’s, their basic function, and what is going on currently in the world of MPA’s. The website is extensive, and contains many sections including: “About MPA’s” (offering a general history and background)  “National” System” (describing the ones in existence and the process for nominating an MPA”), “Data and Analysis” and Resources.

Something I learned from this website is that there are other reasons for creating an MPA besides consrevation. These are referred to as De Facto MPA’s, and may be created for a variety of reasons like human safety, or economic reasons.

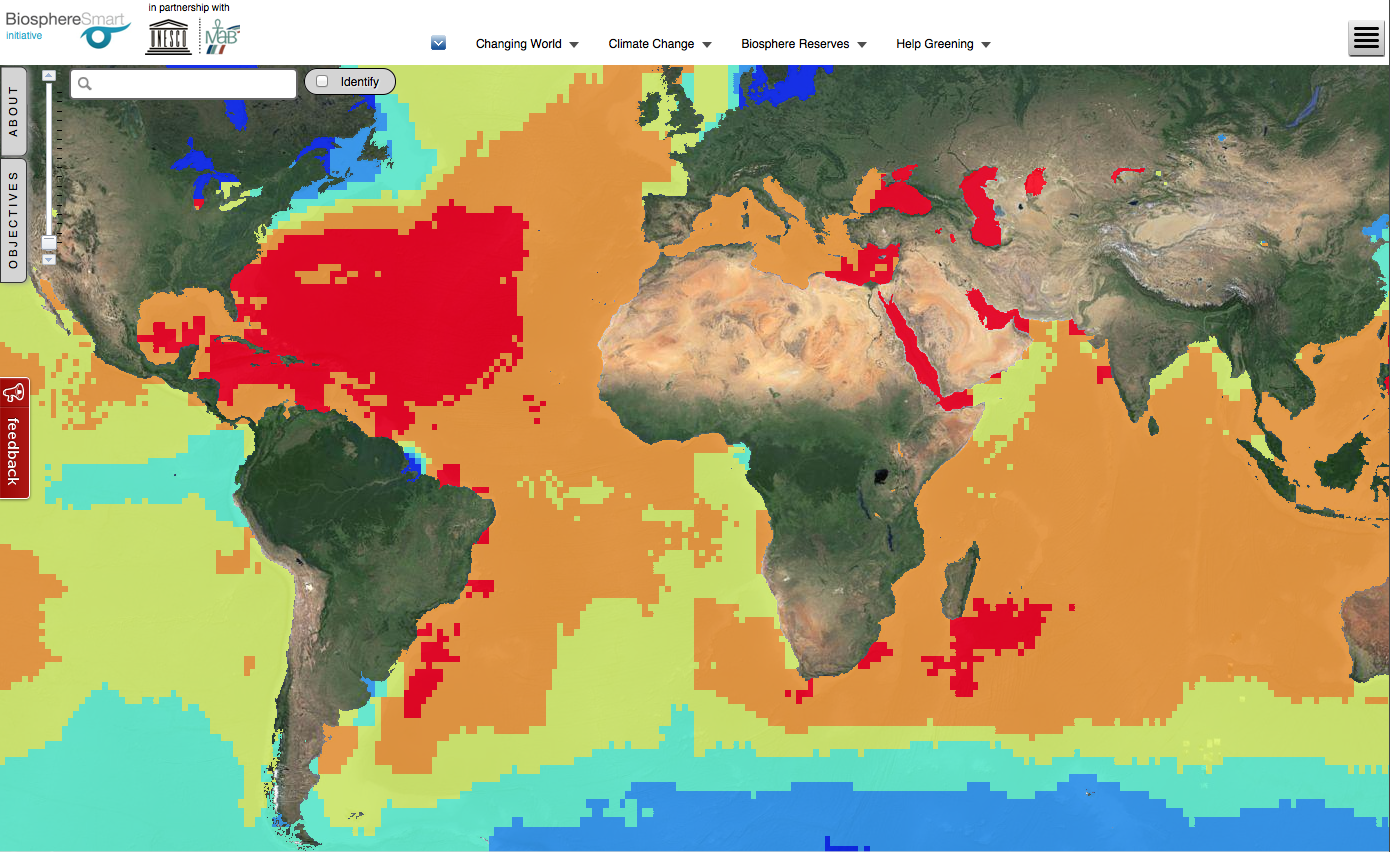
De Facto MPA Map- examples in the Gulf of Mexico


According to the website, there are over 1,234 De Facto MPA’s in the U.S. Most of these De Facto MPA’s are located in the Gulf of Mexico.

Another section I found interesting was the one that described the nomination process and criteria required to nominate an area to become a Marine Protected Area. It’s no surprise that the process is not easy, but the website lays out a clear process and provides links to information and guidance on how to nominate a particular area. There is an area that specifically outlines the benefits of an area becoming an MPA, and a Frequently Asked Question section as well.

The website also includes a database of information on over 1700 the MPA’s within the US, which it refers to as it’s “MPA Inventory”. It classifies and categorizes each MPA and offers comprehensive data on each site in the inventory. This information is extremely useful for anyone trying to research MPA’s for any reason, especially those who are trying to compare MPA’s across time and location.

After reading all the strong opinions by the various essayists in class, it was really interesting to learn more specific details about the Marine Protected Areas that are currently in existence and those that are in the process of becoming one.

LiveScience

This website (LiveScience) does not just deal with geography topics specifically, as it offers a broad range of news sources and studies relating to a variety of scientific fields. Many of these stories relate to physical geography.  The website offers a variety of news stories, videos, and images concerning topics like health, space, and animals. The main tabs that I focused on covered “Planet Earth” and “Space.” The stories found on the “Planet Earth” included a large range of topics that we have discussed in class, such as the effects of global warming, access to freshwater, and the state of coral species who are reacting to warmer waters. The “Space” tab provided information such as the effects asteroids could have on Earth and Earth-size planets that could support life. All of these news stories are easy to read and include links to further scientific resources that could be used to learn more. Most stories are also accompanied by videos or photos to help illustrate the story.

LiveScience also shows the scientific topics of the day that are “trending,” such as global warming or military and spy technology. This site also offers links to other additional resources that relate to these scientific topics.

Overall, it is a helpful compilation of recent news stories that relate to a variety of scientific topics. They are fairly easy to read and can be understood by the general public. Based on our recent discussions in class, websites like these could be a helpful link to bridging the gap between the scientific community and the public on matters like global warming.

To visit the site: http://www.livescience.com/.

BiosphereSmart

The website that I chose is an interactive tour of the world. The purpose of the website is to visually show how climate change has affected or will affect the Earth and its systems.  It’s also provides a good visual summary of how much humans have impacted these systems. It offers 4 categories to choose from: Changing World, Climate Change, Biosphere reserves, and Help greening. In changing world, users can choose from one of Earth’s 4 systems: Lithosphere, Hydrosphere, Atmosphere, and Biosphere as well as a 5th one, Antroposphere. Within each system, users can choose a variety of topics that are associated with each system and can visually see the distribution or levels of each topic around the world. Climate change category is of course all about climate change and it’s causes. Users can visually see all the changes that occur with climate change and where on the planet will be most affected. Biosphere reserves category shows the many reserves and world heritage sites on the planet today and their boundaries. Finally the last category, Help greening, talks about how humans can help to slow down climate change and make a contribution to the healthiness of the Earth.


This is a really good website in which it isn’t just about giving facts and information but provide visually appealing graphs/data/pictures, allowing users to quickly determine where on the Earth each topic is occurring. It provides a sense of scale. I really liked the website because instead of actually reading about what’s going on in the planet, I get to actually see how much damage is occurring to the world and where. And so this website relates to everything that we have been learning in class.

http://www.biospheresmart.org/#


Breathing Earth

The Breathing Earth simulation website is really interesting because it shows country by country the amount of tons of CO2 admitted for a certain time period, usually a minute or two, since you’ve been watching and per person. It shows, by color the countries who admitting the most and those who are admitting the least. Lastly, it shows the population of each country, how much it’s growing or decreasing and how many people are being born and dying while you are watching.

This site does a really good job of connecting different aspects of CO2 emissions, in terms of different countries and people. I think being able to compare population and emissions of different countries with each other is a really useful tool, it shows the countries, like America, which are really using more than they likely should be, in terms of population proportion. It is also really useful to see counties that are not currently emitting a lot of CO2 but have rapidly increasing populations, for instance many in Africa, to think about how these pollution may increase as their population do, especially with increasing modernization globally.

This website is relevant to what we are doing because it addresses pollution and human impact on the world, especially in the greater context of human development and changes that are occurring as a result. While it obviously isn’t completely accurate as we don’t yet have the technology to provide real time data with such speed and precision, it is based on reputable statistics and does well to prove the point its trying to make. At the bottom of the site the creators have also provided information on where their data comes from, why it is important and what can be done to reduce emissions on a personal level, which I find to be very helpful and interesting.

http://www.breathingearth.net/

USGS Education: A resource built for you

For more information go to http://education.usgs.gov/

Communicating results of scientific research to multiple audiences is a critical component of the geographer’s work. Public opinion on important scientific matters such as climate change and evolution may be highly affected by political battles, and effective communication of scientific information is necessary. The USGS Education website tries to tackle this challenge by sharing videos, animations, lectures, maps, and diagrams explaining a range of topics from the water cycle to volcanic ash.

You can access numerous resources

USGS Education contains three primary sections: Primary Education, Secondary Education, and Undergraduate Education. Geography topics in the website include geomagnetism, plate tectonics, rocks, Earth history, earthquakes, wildfires, and more. For children in primary school grades, USGS has made public a series of activities, games, coloring pages, and stories that teach them about animals, wild birds, climate change, and bee population declines. Kids may also sign up with their class to be volunteers and monitor plants and animal species found across the US. For the older kids and teenagers, podcasts, tables, diagrams of the scientific process, and simple raw data are available in the website. Students are able to post their questions and USGS scientists may answer their questions in a series of brief videos. Publications “written for the general public” and “simple explanations” are available too.

For those completing their undergraduate studies, USGS has published online seminars, research on invasive species, raw data, reports, maps, and debates on climate change. Online lectures recorded at USGS facilities are also available and they include topics on the atmosphere & weather, biology & ecosystems, climate change, coastal and marine science, earthquakes, geology, human health, mapping and remote sensing, and more. Essentially, everything you may need for your final and beyond.

Throughout the semester we used USGS data to explore floods and streamflow levels. We produced some interesting reports but, in practice, our work would probably not generate much response from a general audience. The USGS Education site is a great resource to communicate many of these crucial findings to large and diverse audiences.

Ocean Observatories Initiative

In the well-known television and film series, Star Trek, space is often referred to as the “final frontier.” However, much closer to home, the earth’s oceans remain relatively un-explored and a major mystery for scientists, geographers and oceanographers today. The website I reviewed is dedicated to a project aimed at answering the unanswered questions of the deep seas.


The website, http://www.interactiveoceans.washington.edu is designed to inform the public about the National Science Foundation Ocean Observatories Initiative. According to the website, a greater knowledge of the ocean’s interrelated systems is vital for increased understanding of effects on biodiversity, global warming, ocean and coastal ecosystems, environmental health and climate. Furthermore, the website stresses the need for more real time data, over extended periods of time, so that we can be better prepared for future catastrophic oceanic events. 


In order to accomplish these tasks, the National Science Foundation has created the mission of designing and constructing a U.S. regional cabled ocean observatory in the Northeast Pacific Ocean that will serve researchers, students, educators, policymakers, and the public. These cable networks will provide significant electrical power and high telecommunications bandwidth in real time to an array of sensors located on the sea floor and throughout the water column. The hope is that these cable systems will enable scientists to understand more fully the major ocean currents, active earthquake zones, creation of new seafloor, and marine plant and animal environments. 


The first cable ocean observatory to be implemented will be launched with nearly 900 kilometers of cable across the Juan de Fuca tectonic plate, running from a shore station in Pacific City, Oregon, out to the Juan de Fuca Ridge and south along the Cascadia subduction zone to Hydrate Ridge.

The website includes links to pages discussing what the project is, the technology and instruments involved, maps of where the sites will be, the research that the cable systems will provide, how it can be used as an educational too, data already collected, and a gallery of photos and maps. The picture below shows the essentials for the cable system.

This website was very interesting, and I highly recommend it if you are at all wondering how we are going to be monitoring oceans and oceanic events in the future (like ocean crust earthquakes and tsunamis).


Geocube – The world of Geography

This fascinating geography tool is based on the idea of Rubik Cube, with six faces that cover fifty-four geographic topics. It contains numerous videos and informative descriptions about different aspects of physical geography, and is extremely easy to use online. The Geocube was created by the European Network for Geography in Higher Education(HERODOT), and is available to the general public.

The topics that the Geocube’s six sides represent are widely varying, and provide a great overview of our earth systems. In addition to having videos represent every aspect of the cube, there is also a written description of each side of the Geocube. The six sides are: the fascinating earth, living together, shrinking planet, useful geographies, exploring our world, and the earth from all angles.

The different sides of the Geocube covers everything ranging from humans living in harmony with each other and the environment, to the affects and causes of earthquakes and tsunamis. This is an incredibly valuable geographic tool, and displays all of the earth’s systems and geographic aspects in an easy to use and concise method.

The link to the Geocube website is here:http://www.geo-cube.eu/

Combining Geography and Art

In science, findings and knowledge are usually spread through papers and reports that are usually contained within the scientific community. Terrain.org is an online journal that helps ordinary people, environment enthusiasts, and experts spread their thoughts and findings through a very different channel: art.

On Terrain you can find literary art like poems and prose; you can find visual art like photographs and videos; or you can read informational pieces through nonfiction work, columns, interviews, and articles about urban centers. Terrain tries to connect the physical and natural environment to the built and human environment. Readers and viewers can really gain insight on issues involving these two contrasting realms. Terrain says that “the works contained within Terrain.org ultimately examine the physical realm around us, and how those environments influence us and each other physically, mentally, emotionally, and spiritually.”

Although the works are more personal pieces and not based on experimental findings, all topics pertain to either environmental/geographical issues or an individuals personal feelings on the topic. It’s a unique space and translator for the natural environment and gives a different perspective to physical geography than what we usually encounter in class.

Suggested Pieces:

BioMap2: Conservation Roadmap for Massachusetts

Antarctica: A Year in Photos by Ben Adkinson

Interview with Andres Duany ( Founder of Duany Plater-Zyberk & Company: the architectural firm in charge of the East End Transformation Project in Richmond)


“How Stuff Works:” Volcanoes

The Website that I reviewed was from the Science portion of the website “How Stuff Works.” Specifically it is an interactive model and game called ‘Volcano Explorer.’ It is both extremely informative and interesting. They have a rotative model of the Earth that describes the structure of tectonic plates and global distribution of volcanoes worldwide. Additionally, they have interactive tabs that discuss the different types of volcanoes and how they work by using animations, as well as tabs to describe what the inside of a volcano looks like, in addition to an interactive description of the interior of the Earth. Each of these tabs has a bunch of sub-tabs which describe and visually animate the creation process and eruption process of these volcanoes. These are really cool learning aids. Finally, the game is probably the best part. You can actually create your own volcano. You set the viscosity and gas content of the volcano, and the animation responds by visually showing what the volcano itself would look like, what type of volcano you just created, where a comparable example can be found on Earth, and shows an animation of this style of volcano erupting.

I think that this website was both very fun and very informative. Although the interactive volcano game was just a section of the website, there were many other Earth system animations and interactive diagrams that were very cool as well. Even though it was the science tab on the “How Stuff Works” website, the vast majority of the content related to Earth Science or Physical Geography. The beauty of this website is that it combines education on a very detailed level with a fun game. Being able to visually see all of these processes, while still maintaining great detail can be a great study aid.

Here is the link to the interactive animation and game:

http://science.howstuffworks.com/nature/natural-disasters/volcano-explorer-game.htm

The Climate Wizard

The Climate Wizard is an interactive map that allows users to view the future predictions for temperature and rainfall as well as historic records for any area in the world; available at http://www.climatewizard.org/ The Climate Wizard allows users to specify analysis area, time period, climate model, average temperature or precipitation, and average or change. Analysis area allows users to select either global or specific regions, such as a state, although increased zoom is available.  Climate model can also be changed to see different prediction levels; low, medium, high.

The interactive map allows users to visualize what a particular region of the world will look like in 2050 or 2080, hopefully educating users on the changes that can be expected. The Climate Wizard also allows users to look back over the past 50 years to see changes that may have already occurred. Modeling precipitation and average temperature may also help local governments and policy makers take climate into account in decision making.

The Climate Wizard was developed in a collaborative effort by The Nature Conservancy, University of Washington, and the University of Southern Mississippi in 2009. The data for creating the predictions for specific regions of the world was gathered from Oregon State University and a variety of other contributors that model changes in precipitation and temperature.  The Wizard uses data and predictions from the IPCC fourth report. Hopefully the Climate Wizard will be updated with the predictions from the IPCC fifth report.