BBC – Climate Challenge

With scientists around the world gathering data in support of climate change accelerated by human factors, the BBC created a game to introduce some of the dilemmas this may present to governments around the world.  The goals of the interactive atmosphere is to give players awareness of what causes climate change, describe policy options available to governments, and give a sense of the challenges facing international climate change negotiators.

In this interactive game, you play as the president of the European United Nations, and you represent part of the Intergovernmental panel for climate change.  The game consists of ten turns, with each turn representing a decade.  In each turn, you choose up to six policies to enact during the decade, which impact the economic standing of the European nations, as well as energy, food, and water factors.  Some policies also have a positive or negative environmental impact, to reduce or cause more emissions linked to climate change.  Linked with these policies are popularity meters, based on how the public likes or dislikes the proposed policies – as the President of the European United Nations your job is to establish a strong policy on climate change while keeping the countries happy with your decisions and healthy so that they will continue to elect you to the intergovernmental panel for climate change.

The policies that you choose from in the game are based on actual governmental policy documents (except for those near the end of the game in more futuristic conditions).  The scale of the decisions and their impact was scaled back to a single turn for simplicity, and even with this simplistic model the game presents the player with good background knowledge on where policy makers may be having the most trouble meeting climate change requirements and ensuring cooperation with politicians from other governments.

When I played the Climate Challenge, I tried to meet every goal set for the climate reduction plan every 30 years (3 turns).  While I was effective in keeping my popularity up for the majority of the game and successfully meeting environmental and emission standards, sometimes my concern for the well being of the people in the European Nations wasn’t as high as it should have been. My results page showed scores of Environmental policy: 89% effectiveness; Wealth: 13% effectiveness; Popularity: 20% effectiveness.

The content of the game does a remarkable job of highlighting different consequences for potential actions, placing the player in the role of a politician fighting to recognize climate change and enact policies corresponding to their impact on reducing human impacts on climate change.  It is easy to get lost in the game, learning as you make policy decisions and seeing the potential impacts on the status of nations having to enforce these policies.

The link to the game is here: http://www.bbc.co.uk/sn/hottopics/climatechange/climate_challenge/

A link to the background and description of the game is here: http://www.bbc.co.uk/sn/hottopics/climatechange/climate_challenge/aboutgame.shtml

Exploring the Ocean Floor with Nautilus Live

In our modern world of of GPS, when it seems like there is no frontier left, the ocean floor remains largely unexplored and unmapped. This website, hosted by National Geographic, follows the crew and scientists aboard the Nautilus. The crewmembers’ most recent mission was from June to November 2013 to explore the Gulf of Mexico and the Caribbean, mapping geological, biological, archaeological and chemical aspects of these areas to depths of about 2000 meters. Highlights of the trip included new discoveries of shipwrecks.

The beauty of this website is that it allows the general public- elementary school students, college professors and scientists, and average curious people- to connect with the crew. The website includes pictures from the missions, including this one of the bow of a shipwreck.

Additionally, the site provides videos of the ship’s robots, Hercules and Argus, at work, collecting samples thousands of feet below the surface. This is an image of Hercules using a temperature probe to test an underwater volcano:

The most interesting part of this website is that during missions, it connects directly to the crew aboard the ship. It shows a live video feed of the ship’s activities and allows students and the public to chat live with the Nautilus’s educators, who respond on an audio feed to students’ typed questions.

Finally, the site includes helpful links for teachers and kids, including interactive mapping and robotic design games to encourage and inspire future geographers to explore the ocean frontier.

http://www.nautiluslive.org/

Interactive Science Models

This website (Learner) is funded by the Annenberg Foundation to provide educational resources in order to improve teaching quality. This website offers interactive simulations, quizzes, study flash cards and lesson plans for subjects ranging anywhere from foreign language, math, science, history and art. The material is tailored for students in Prekindergarten through college and is a great study tool! I recommend poking around on the website and looking at some of the simulations in all subjects.

Below are a few of my favorite simulations, that relate to the class. There are tons of physical geography interactive simulations such as understanding the composition of Earth, plate tectonics, carbon and energy cycles as well as volcanoes, astrology and evolution. This website is both fun, engaging and educational. It’s definitely worth a look!

http://www.learner.org/resources/lessonplanbrowse.html

Obama vs. Climate Change

Earlier this month, the White House announced the establishment of a new website, climate.data.gov, created to educate Americans about climate change and its widespread detrimental impacts. It was created under the supervision of John D. Podesta, President Obama’s counselor, and John P. Holdren, the White House’s science advisor.

The goal of this website is to inform the public about the importance of climate change problems and to increase awareness. The ability to bring the relevance of such environmental problems to a local scale will hopefully make the concept of climate change more applicable to the individual. In its “pilot” stage, the website will include topics related to coastal flooding and sea level rise, along with the past and potential impacts of these phenomenas. This webpage is planning to expand these topics to include additional climate-related impacts, such as human health, energy supply, and energy infrastructure.

The website provides the tools, data, and information that can eventually be converted into software stimulations by research and private companies. Companies who plan to use this newly available climate data include Google and Esri. This web page will include numerous digital and interactive maps in order to present the data in an engaging and informative manner. For example, the site includes post-Sandy maps for New York and New Jersey that show how the floodplain will change if sea levels rise to certain levels.

This webpage has the potential to help make predictions, raise awareness, and manage risks regarding climate change. As the engineering manager of Google earth puts it, “what if we could make information about sea-level rise, extreme heat and drought as simple to digest and interactive as sung Google Maps to get directions?” This site has the potential to bring us a step closer to that.

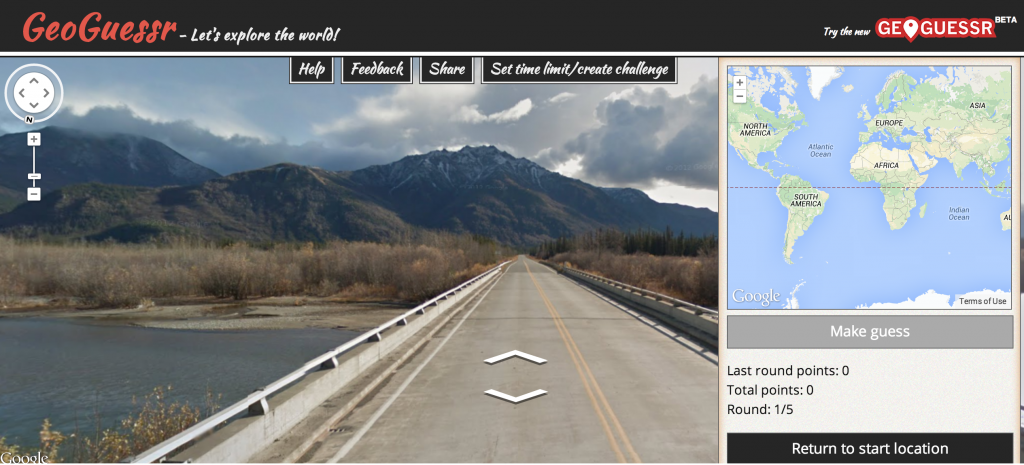
GeoGuesser – Let’s Explore The World!

Use your knowledge of the lithosphere, pedosphere, and biosphere to guess where in the world these google map locations are!

Think you’re a geography expert? Test your knowledge with BBC Travel’s Geoguessr – the game that proves how well you know the world! As we explore the Lithosphere and Pedosphere and Biosphere check your skills against your knowledge. First, move around using your mouse and figure out where you are. Do you see some rich, red soil? What about volcanoes, palm trees, deserts, or oceans? Using your physical geography knowledge, try and guess where in the world you are located.Then click on the map in the lower right hand corner to place your marker (zoom in to increase your accuracy). When you’re sure, click the “make a guess” button, and find out how close you were!

Over 5 million miles of roads in street view by June 2012.

Unfortunately, because the site relies upon google maps, all locations will be along roadways limiting the world to just the 5 million miles of roads with street view images in over 39 countries.  Once you’ve mastered the basics, challenge my most recent score by clicking on this link. The world’s a huge place – get exploring and post your highest scores in the comments below!

Find out how close you were to each guess!

New ideas for Climate Engineering

As the international community’s efforts to combat climate change slow, ideas or technologies that had once been labeled as outlandish or silly are being given a second thought in the US.


The National Academy of Sciences has gathered a team of climate scientists to consider ideas such as power plants that remove carbon dioxide from the atmosphere or mirrored satellites that reflect solar energy back into space. Even the CIA has shown interest in such plans. Scientists at the Jet Propulsion Lab in La Cañada Flintridge and the Pacific Northwest National Lab (funded by Bill Gates) in Richland, Washington are beginning to study what these technologies would do to weather patterns. Although there is massive interest in these new ideas, many people have expressed concerns over the risks of tampering with the climate in this way. Some explain that getting the public’s hope up for geo-engineering as a way to halt climate change would undo or lessen support to lower greenhouse gas emissions.


Agencies are also having trouble designing and understanding how laws would factor into the possibility of controlling the weather. Technologies, they explain, may be produced and used by anyone without any policing by international or even national laws. In 2012, a California businessman put 200,000 pounds of iron rich dust off the coast of British Columbia to encourage a plankton bloom in hopes that the plankton would increase the ability of the ocean to absorb carbon. In the same year, British scientists planned on spraying liquids at high altitudes to see if the liquids would have a similar cooling effect to that of volcanic ash in the atmosphere. However, the plans were stopped because people were unsure if field tests should even be occurring if there  was no regulation. Scientists even argued that if such a plan were carried out on a large scale, it could have extreme ramifications and could make current droughts of floods worse.

Technology used to brighten clouds


What scientists in labs are seeing right now are enormous influxes of new, and often strange ideas. The most realistic ones seem to be those that involve removing carbon from the atmosphere. Those that redirect sunlight would be faster to implement but would also be more risky. Scientists fear that if we actually use the new technologies and they fail or crash, the backlash from the environment itself could be so severe that humans would have little time to adapt or come up with a new plan. As people become more desperate for a solution however, those who fund research and those who make laws have become more open to different possibilities which has opened the door to exploring ideas to reverse the effects of climate change.


http://www.latimes.com/nation/la-na-climate-engineering-20140305,0,5604112,full.story#axzz2vCU0yGZJ

Home Computers to Join the Fight Against Climate Change in England

Within the last year, England has experienced some of the worst flooding to date. While researchers at Oxford University attempt to model the climate change during the 2013-2014 winter season, help may be also found at the local level through England’s home computers. Professor Myles Allen, head researcher for weather@home, claims “basic physics shows that warm air holds more water and rainfall gets more intense, but added that the chaotic nature of weather means that no specific flood can be attributed to human-induced climate change alone.” Essentially, Allen and his team looks to determine what causes the floods in England. Whether it be natural causes or human-induced factors, local computing power will come into play to help find the answer. One set of computer models will start at the beginning of December 2013 and rerun over 30,000 times while another computer model set will run according to a world “without climate change.” Deciphering the models will act as substantial data behind debates concerning the influence of climate change on extreme weather. People around England will soon have the ability to chime in and fire up their computers against climate change. Additionally, these local people can actively see increases and decreases on their monitors pertaining to the relationship between flooding and climate change in England over the past year.

H-2-oh my gosh, that’s not a lot!

We all learned that Earth’s surface is 70% water in elementary school, but how much water is actually on Earth and what does it look like in comparison to Earth’s size? This drawing from the USGS shows the surprising answer: a pretty small volume relative to the entire globe.

Global water volume visual representation by the USGS

There are three blue spheres in the image laid over top of the North American continent that show, in order of decreasing size, all the water in, on and above the Earth; liquid freshwater in groundwater and small water bodies; and all the freshwater in lakes and streams which is where most of our water used every day comes from.

This website also describes the Earth’s water distribution in tables and graphs. The less than 4% of Earth’s water that is fresh is vital to humans around the globe and most of it is contained in glaciers and ice as well as underground.

In class, we’ve learned how the Earth is a generally closed system (with regard to matter) and that every aspect is related and dependent. This website definitely shows an understandable breakdown of where our water comes from and why every part is important. It also gives a great spatial representation of the water on Earth in comparison to the size of the Earth. I was actually surprised by the visual!

Climate Time Machine

On the NASA website, I found a list of several interactive activities related to climate change, water cycles, and the solar system. In class, we have discussed different models portraying climate change and how the Earth is changing with climate change. This interactive activity gives a visual of how sea level rising could affect  the coasts in the US, the Amazon Delta, Northern Europe, and Southern Asia,  how arctic ice cover has diminished by about half since 1979,  how carbon emissions have increased in the past 10 years and the change in global temperature in the last 130 years. I found this website really helpful at understanding just what is happening on Earth. The pictures make the change seem even more real than other charts I have seen. I hope everyone can check it out!

http://climate.nasa.gov/interactives/climate_time_machine