Interactive World Forest Map and Tree Cover Change Data

Global Forest Watch’s website lets people explore recent deforestation and fire alerts, analyze historical trends in tree cover loss and gain since 2000, and read the latest reports on tropical forest loss. For each factor that one can look at, one can also do an analysis of a location just by clicking on that area. For example, for tree cover loss in Virginia, the website provides number data in Mha and percentages of the amount of tree coverage between 2010 and 2021, tree cover loss from 2001 to 2021, tree cover gain from 2000 to 2020, and tree cover by type as of 2010. When choosing an area to receive analysis on, you can choose it by political boundaries, terrestrial ecoregions, or river basins. There are also tons of different map layers that one can turn on or off such as burned areas, logging concessions, and biodiversity hotspots. 

This website gives a very wide variety of information around the globe on the world’s forests and tree coverage. It can be useful to many people from students, to researchers, to scientists, and to the general public. It provides the tools for monitoring forests that are accessible and easy to understand for anyone. It gives current information on how our world’s forests are changing. Global Forest Watch is also a great resource for watching for forest fires, illegal deforestation, and any unsustainable activities. Listed on the website are many of the impacts that having this data readily available to the public creates such as the Amazon Conservation Association using this site to stop United Cacao from illegally clearing forests in Peru. 


Keep Bears Wild – AF

Keep Bears Wild is a website created to track bears with GPS collars, bears hit by cars, and bears that are being used as a case study. This is a very site-specific website as it is only tracking bears in the Yosemite Nation Park area. It is beneficial to both park rangers and visitors who want to protect and learn more about these animals.  The website not only provides a map of bears that have been tracked but it also provides a number of strategies and priorities created under the Human-Bear Management Program. Some of these management practices include Education and Outreach, the ‘Red Bear Dead Bear’ project, and Food Storage Practices.

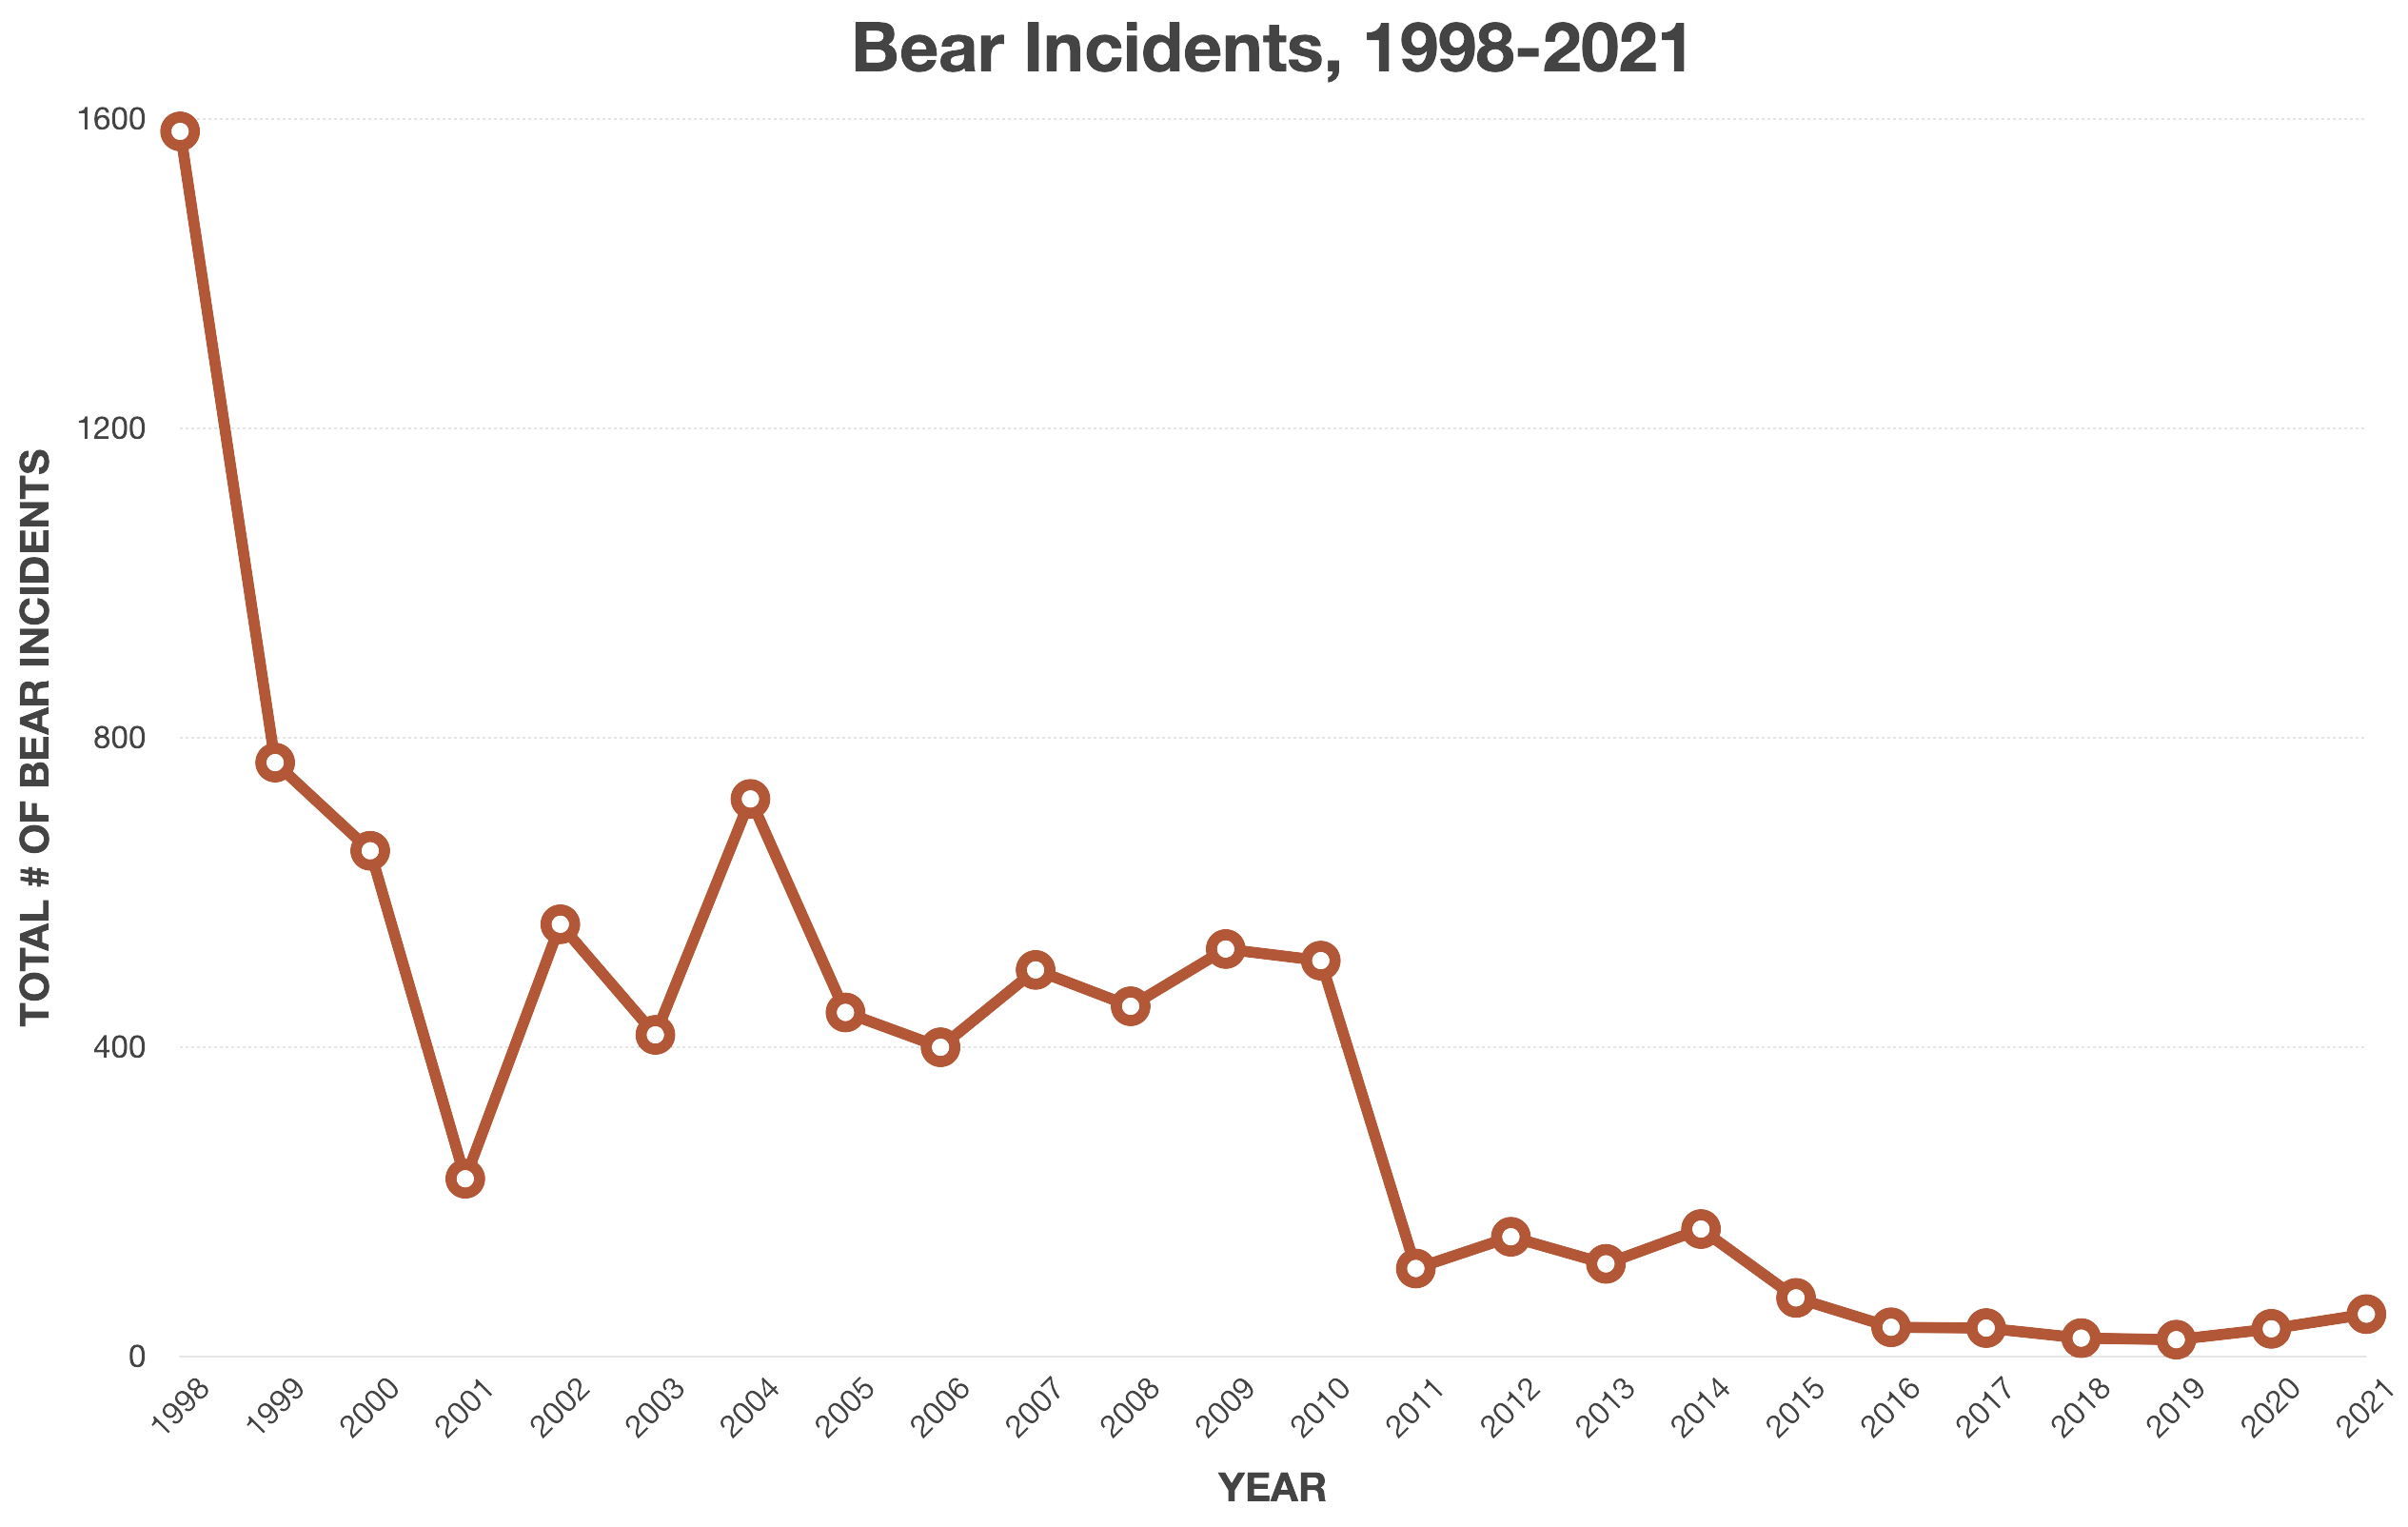
This website is a great tool for learning more about protecting bears, safe practices/what to do if you encounter a bear hiking or camping, and provides insight into bears lives in Yosemite National Park. They play an important part to the ecosystem and have in the past been facing human based deaths as the graph below illustrates. Thankfully these deaths have significantly decreased in recent years showing the importance of advocating and creating environmentally safe management practices and policies.

Earth History! (Zazi Halla – Fall 2022, Biosphere & Lithosphere)

Link

This website, https://dinosaurpictures.org/ancient-earth#35, shows the progression of Earth all the way back to 750 million years ago during the Cryogenian Period. It is an interactive tool because you can view whatdinosaurpictures.org/ancient-earth Earth looked like by changing the time frame (ex: select “what did Earth look like (x) years ago”. Most notably, this shows changes in the lithosphere because Pangea can be seen breaking apart due to tectonic plate movement. This website also connects directly to our lithosphere unit by illustrating places where isostatic rebound can be occurring. For example, students can change the time-scale and see how glaciers have been melting (a cause of isostatic rebound).

This website also connects to the biosphere unit, because there is an option to look at Earth based on what major species were present at the time. For example, you could look at when the first algae on Earth appeared or when the first land animals appeared. Students can try to infer how atmospheric changes influence biomes across Earth and subsequently provide habitable zones for different species over Earth’s history. Additional information is also provided on the diversity of species at the time. For example, when land animals appeared on Earth, it details that during this time “Insects diversify and fish develop sturdy fins, which eventually evolve into limbs”. Very cool stuff!!

From Garlic Mustard to to Lettuce Aphids to Egyptian Geese – Stay Up to Date!

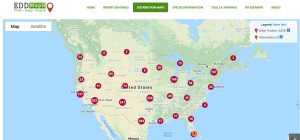
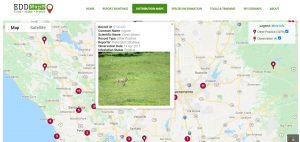
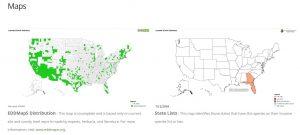
EDDMaps collects crowdsourced sightings of plants, insects, diseases, and animals to track distribution and presence across the US. It enables users to report a sighting accompanied by a photo, creates interactive maps of all sightings of a particular species, provides information on each species’ taxonomy and native territory, and provides downloadable datasets including all sightings of a particular species. Users can easily access maps that show all states or counties with reported sightings or look more generally at the entire country, and grouped point symbology makes it easy to identify areas of the country where the species is most common. Additionally, this website offers user support in accessing and using the available data as well as training in reporting species sightings. The images below feature the information available if I am interested in coyotes (Canis latrans).

The crowdsourced nature of this website is incredibly important to the thoroughness of its data collection. Rather than being limited to a specific team of people, data is being collected on a much wider scale by including the sightings of anyone with access to technology. Such maps of species distribution are valuable in tracking the movement of invasive species and the growth or decline of specific populations. By making this data downloadable and available to others, the site promises to expand access to the data and allow for further study.

This interactive distribution map reporting all recorded coyote sightings in the US

A specific record on the map

Counties with reports (left); States classifying species as “invasive” (right)

https://www.eddmaps.org/


Forest Plots

ForestPlots.net is a website dedicated to tracking tropical forests. ForestPlots contains consistent data on over 2 million individual trees from over 4000 plots in 54 countries. The locations of the plots are displayed on a map on the website, and the data on individual trees may be downloaded for use in scientific studies. The data on this site allow scientists to study tropical forests worldwide and collaborate with other scientists working on tropical forests, which is important as tropical forests are vital to the health of the Earth, especially given our current context of climate change. The website receives funding from UK National Environment Research Council and The Royal Society. This website is relevant to research of the biosphere, and I know we will be able to recognize the importance of the data provided when we get to the biosphere unit.

Already, working on the campus tree survey, we have looked for trees in the Eco-Corridor; although we are not in a tropical forest, the focus of ForestPlots.net, our data will certainly be similar in content and format to the data on ForestPlots.net. I am sure our data will be useful in a similar manner to the data on ForestPlots if it becomes published in any way. ForestPlots.net does make one wonder as to whether there are any similar resources dedicated to forests that are not necessarily tropical.

https://www.forestplots.net/

image.png

Coastal Change Hazards

The Coastal Change Hazards (CCH) site developed by the USGS features a plethora of information to equip anyone, average citizen or researcher alike, living near or simply concerned about any coastal area within the US. The CCH features information on a variety of natural phenomena that impact coastal communities including tides, waves, and weather – namely the hazards presented by severe storms, equipped with the Coastal-Marine Hazards and Resources Program (CMHRP). This information is acquired from Research, delivered to the Stakeholder Engagement and Communication (SEC) sector, and is applied in the Technical Capabilities and Applications (TCA) sector of the CCH program. Secondary pages within the CCH site include the Coastal and Marine Hazards Resource Program (CMHRP) -which includes a USGS Coastal and Marine Geology Data Catalog, a decadal strategic plan, and newsletter – Pacific Coastal and Marine Science Center, St. Petersburg Coastal and Marine Science Center, Woods Hole Coastal and Marine Science Center, and “science stories” about coastlines around the nation.

While coastal counties (with the exclusion of Alaska) account for only 10% of the landmass of the US, 40% of the nation’s total population occupies them!

https://www.usgs.gov/natural-hazards/coastal-marine-hazards-and-resources/science/coastal-change-hazards?qt-science_center_objects=0#qt-science_center_objects

National Geographic: Paul Salopek’s Out of Eden Walk

Paul Salopek, a slow journalist with National Geographic, is walking the world by foot over the span of a decade, specifically following the paths of our first ancestors who, during the Stone Age, walked out of Africa and into the rest of the world. He seeks the human experience in relation to our Earth. This website is his public journal. Every form of media is bundled up to best represent the human experience. Using ESRI to map his journey and publish dispatches regularly, Paul Salopek essentially connects raw geographic coordinates to stories of individual people and experiences.

https://www.nationalgeographic.org/projects/out-of-eden-walk/

Incident Information System

The Incident Information System (inciweb.nwcg.gov) allows people to find information about wildfires and report new fire incidents. By searching a state, one can find any wildfires in the area and read about the situation’s status, coordinates, fire type and size, and view related news articles and photographs in a full report on the incident. The ability to file reports and have all relevant information in one place is valuable in an effort to prevent wildfires and inform the public on fires in the United States. It can also be useful to scientists conducting research on topics like climate change where abundant country-wide information on wildfires would be beneficial.

https://inciweb.nwcg.gov

Discover Life: A Global ID tool

Discover Life is a website which aims to map the distribution of species across the globe, as well as help biologists ID species that they find. You can use the search feature to search for plants or animals, finding a map of their distribution, identification pictures, ID guides, scientific name, references, and more for the species. One of my favorite features at the top of the website is the IDnature guides. If you click on IDnature guides, you can check select general traits of what you are trying to ID. Try clicking through the check boxes with a specific animal in mind, and then click “search” next to the trait. On the left side of the screen, an updated list of species with all the traits you’ve searched for are available. click “simplify” (towards the left of the screen, above the potential species) once you have a few traits selected, and the questions will become more specific to sift through the remaining animals. Eventually these questions will key out one species! If you are using this to ID something, it is incredibly helpful because it refines itself to only present relevant questions. A picture of this feature is attached to the bottom of this post.


https://www.discoverlife.org/

Wildebeest Migration Tracker

Image

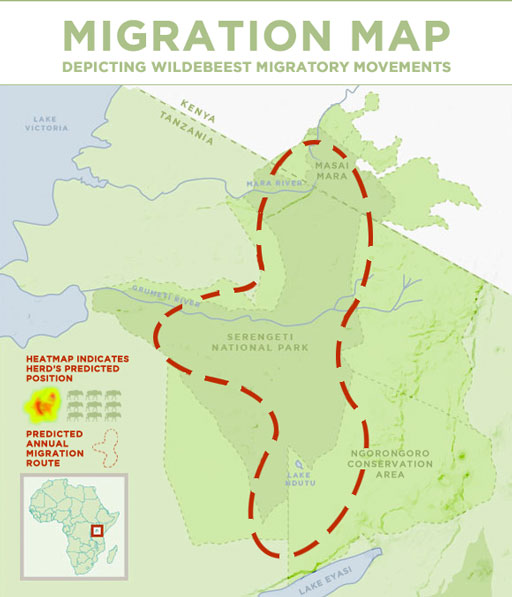
This website gives frequent updates about the Wildebeest migration in the Serengeti happening currently. You can watch videos, read comments, or look at a map of the migration route of these Wildebeests on this website. There are updates almost daily from people that are watching this migration in person and observing where the animals are going and how they are fairing in their migration journey.

Image result for wildebeest great migration map"

Figure 1: Map of the Wildebeest Great Migration (https://www.discoverafrica.com/migration/map/)

Through looking at this website you can learn about the travel of species and why those species would want or need to migrate around, including climate or predatory reasons. There is also a live feed of the migration and maps of the path of migration for every month, as well as general information about Wildebeest migration patterns.

https://www.discoverafrica.com/migration/map/