
After attending the inter-disciplinary presentation on Japan after one year of the triply devastating earthquake, tsunami and nuclear power events, I wanted to do more research on the events of the day March 11, 2011. The chain of events were extremely well documented, and can be found on many websites and blogs, such as the Huffington Post. I found an interactive map from CNN that shows the countrywide impact of the tsunami, earthquake and nuclear power plant failures.

Map of Japan after 2011 Earthquake
The interactive map allows the user to manipulate settings between broad categories of events on March 11, as well as casualties and damages caused. One can see that the epicenter of the 9.0 earthquake was located extremely close to the northeastern coast of Japan, in addition to the recorded 13 aftershock earthquakes that were measured to posses almost as much energy as the original 9.0 earthquake. The most casualties (over 19,000 total) were along the northeastern coast of Japan, but casualties were observed throughout the country. The worst damage was found along the entire northern land of Japan. After the events of March 11, 2011, Japan lost over $44 billion in infrastructure.
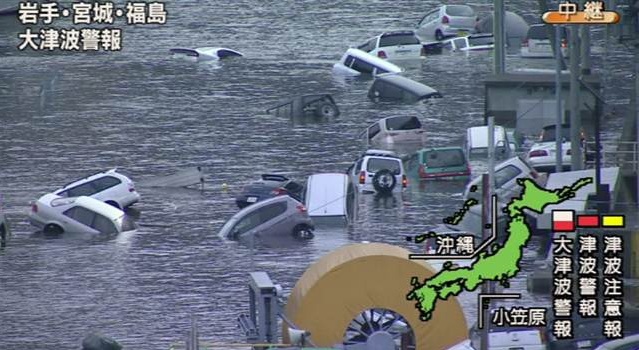
Cars Floating in Japan after Tsunami
The nuclear power plant near Minamisoma video shows utter destruction of the city, where panic grew even more after discovering the possibility of nuclear power plant failure. Many people were displaced due to the earthquake, tsunami, and radioactive zone around the 54 nuclear power plants in Japan. Currently, there are two power plants that are being used for Japanese power and electricity, but by this summer there will be no usable nuclear power plants in Japan. This creates a large economic and political problem for Japan, where there is an apparent shortage of power and electricity in a highly industrialized country. Adding to the problem, Japan is not a naturally resource-rich country: it must import the fossil fuels to make up for the loss of nuclear power (what used to be 30% of the country’s power generation). It is probable that Japan will resort to importing high amounts of fossil fuels (such as coal, oil and natural gas) as power to stabilize the country in the near future.
Japan is on its way to recovery and reconstruction after a devastatingly large earthquake, tsunami and threat of nuclear power plant meltdown, and it will be interesting to watch what Japan must do to remain a large worldpower.
Website: http://www.cnn.com/SPECIALS/2011/japan.quake/map/
This interactive map is a great example of how well documented the Japan earthquake/tsunami was in 2011. Such an interactive map illustrates the mass effects in spatial terms and is definitely helpful in understanding the magnitude of earthquakes and evaluating the dangers of such natural disasters that occur quite frequently. I can imagine that this type of information and its mass communication globally is part of the reason the people of the Indonesia expected a tsunami to follow the 8.6 magnitude earthquake that occurred last week.