

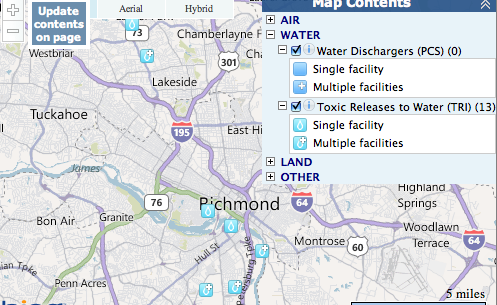
If you are wondering how Richmond compares to other parts of the country in terms of water and energy usage, head to the “My Environment” tool on the EPA website. It allows users to search for cities nationwide, displays a map with local sources of air, water, and land pollution. As geography students, this tool allows us to apply concepts we are learning about water, the atmosphere, and environmental processes to local spaces. The icon for each source reveals the name and address of each potential source of pollutants:
The site also compares local energy production to local energy consumption in terms of coal,natural gas, petroleum, and other sources of energy. Both Virginia and my home state of North Carolina consume more petroleum than any other energy source. While according to the data NC only produces nuclear energy, VA produces coal, natural gas, nuclear, and renewable energy. Data contained on the page is time sensitive, and users can even find out the daily air quality at their location. On the day of this post, my hometown was experiencing the most air pollution from particulate matter, while Richmond’s air was most polluted by carbon monoxide.
The site also encourages community interaction, and contains a “My Community” link where users can report on positive changes being make for the environment. Though the Richmond page does not currently have any news showing, we already know from our geography class that the city of Richmond and the University of Richmond are sensitive to protecting our natural resources.