NASA’s App, Earth Now

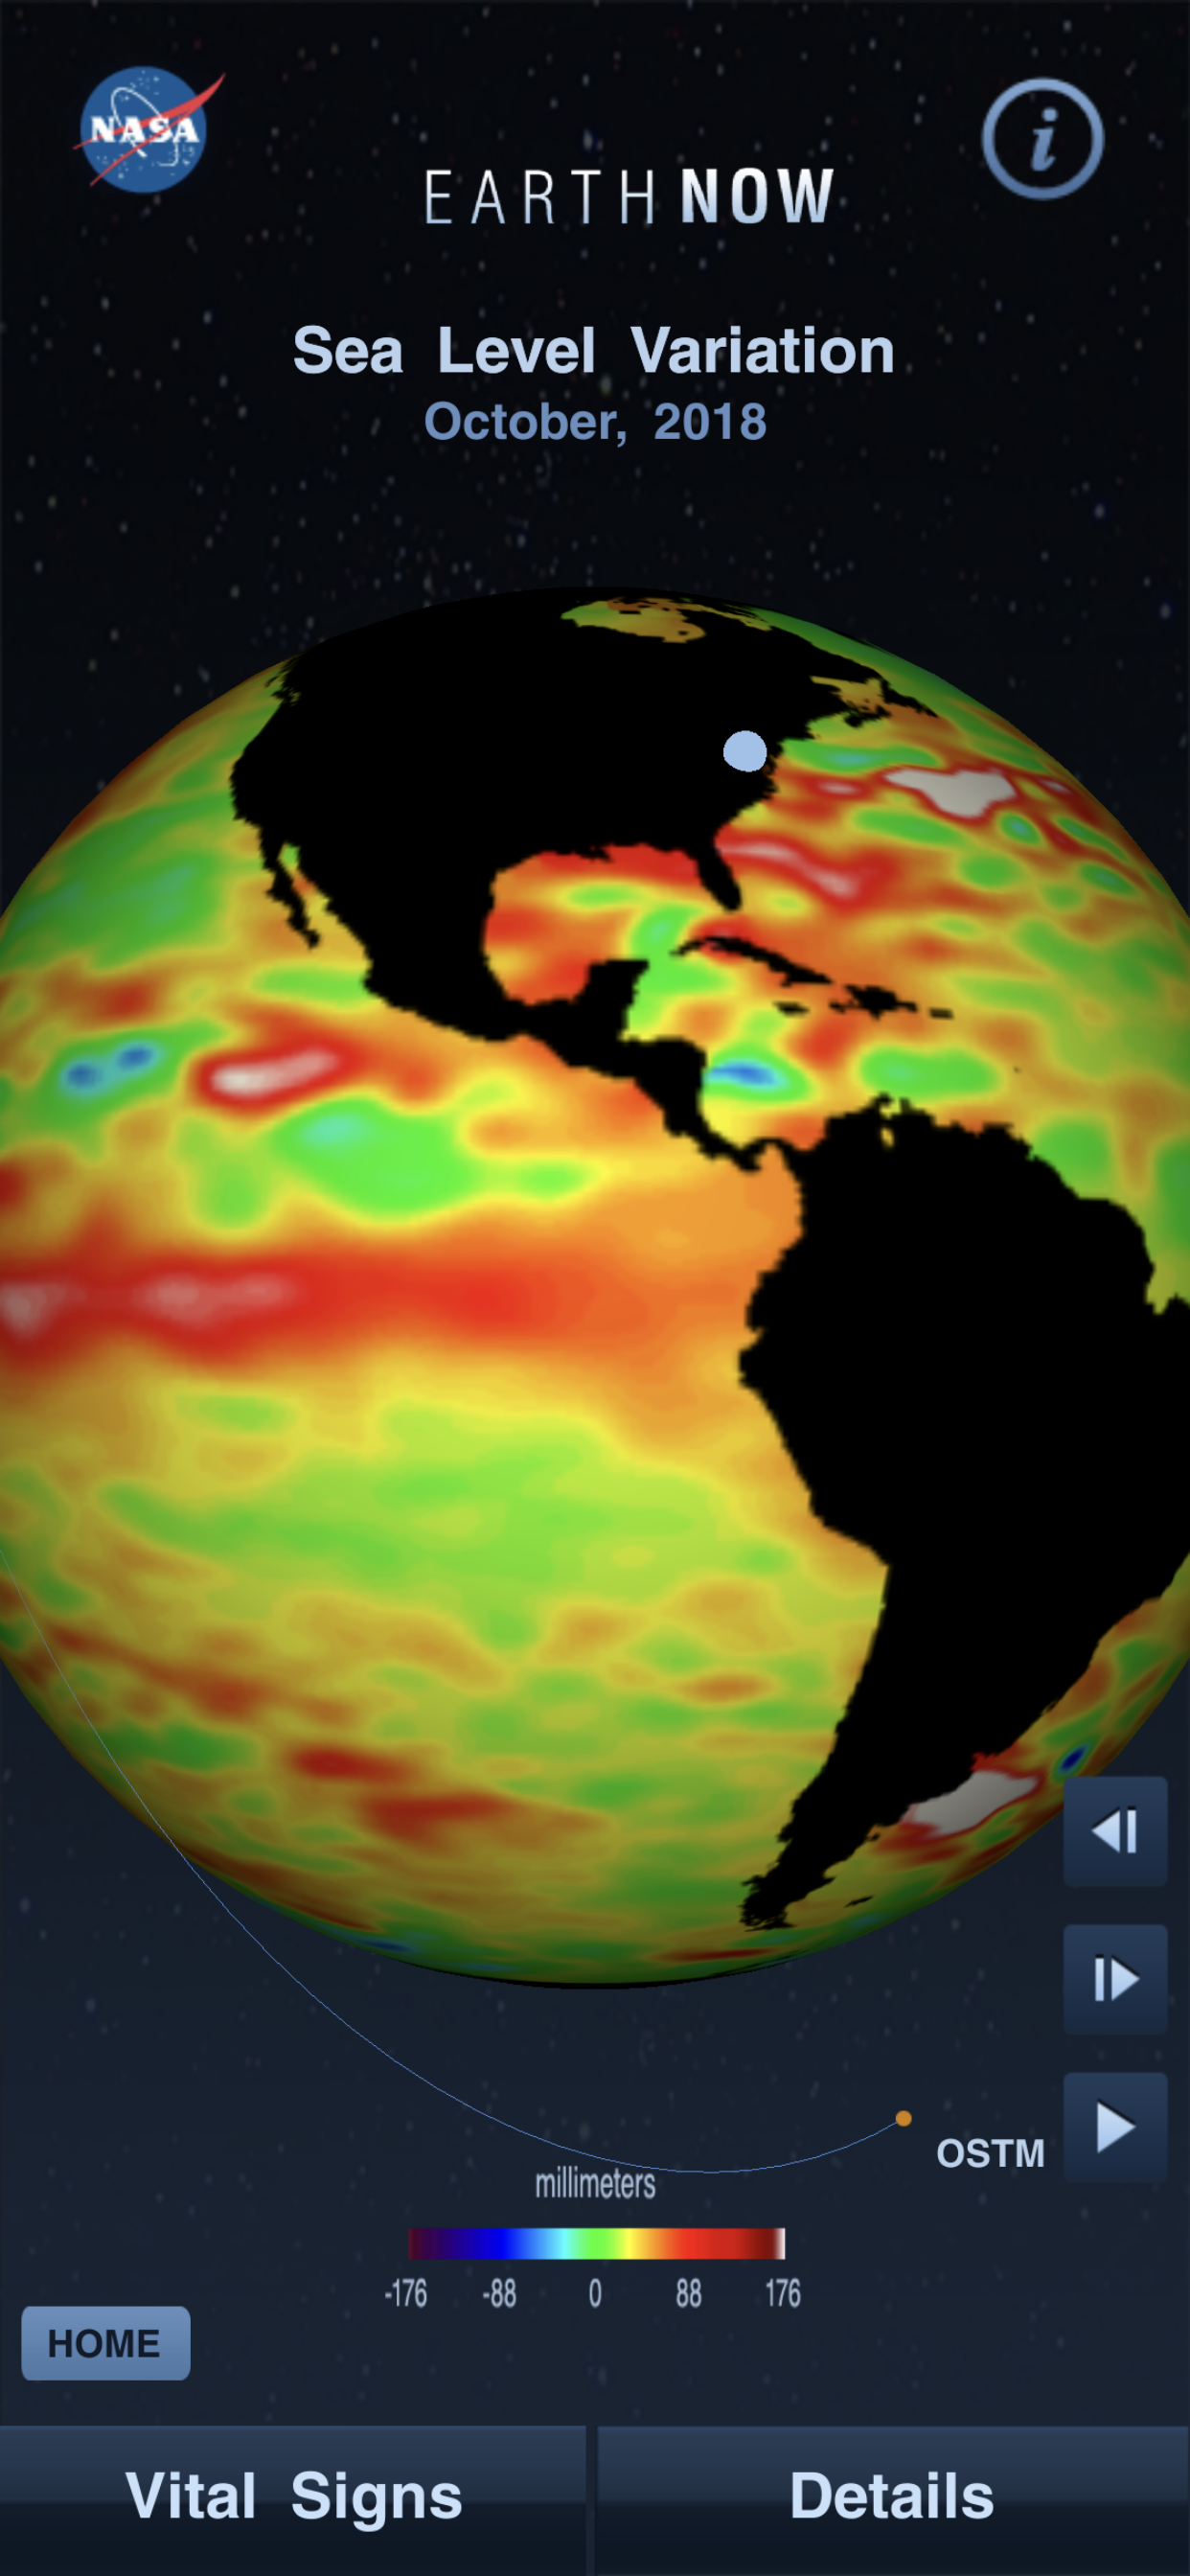
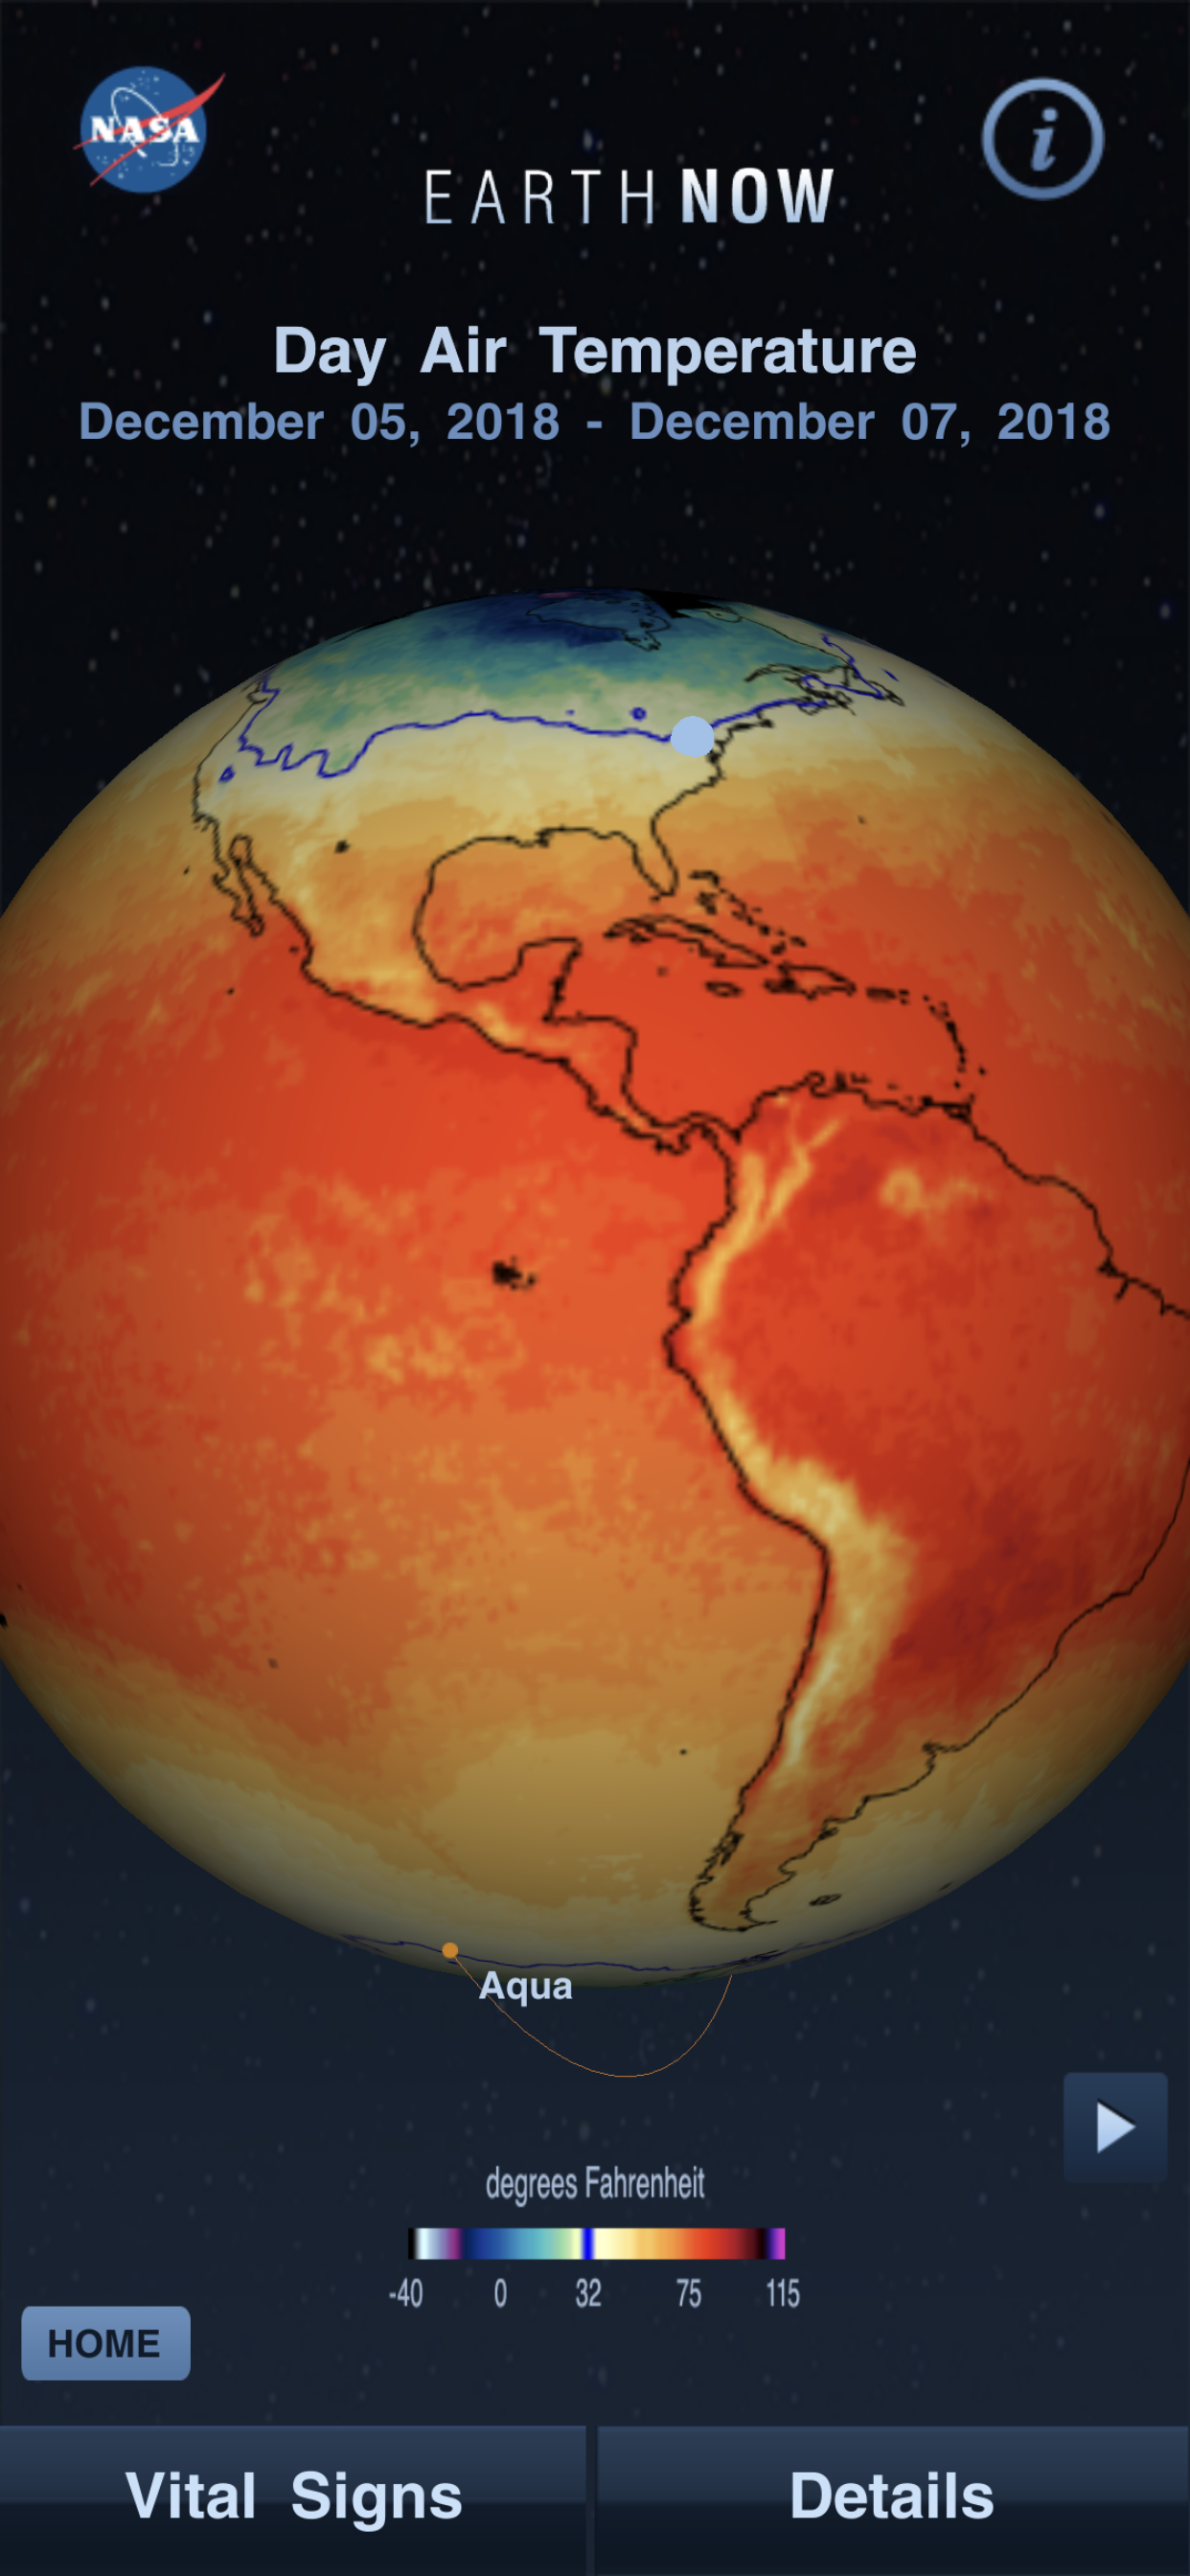
Looking online at NASA’s website, I saw that they released an app called Earth Now. I was interested and downloaded the app (its free). Earth Now shows you recent global climate data from Earth Science satellites. You can choose to see different elements including surface air temperature, carbon dioxide, carbon monoxide, ozone, water vapor, and gravity and sea level variations. The 3D model of Earth will show a color-coded visualization of the relative strength or weakness of an environmental condition. The app tells you the latest events going on around the world as well. It is real time and will show the most up to date data that it has. You can also go back in time to see how the environmental conditions have changed. This is a really great app because it allows you to stay up to date by checking on your phone (especially when everyone seems to be on their phones these days). This is app is very beneficial because it is an easy way for people to stay up to date and informed about the current environmental conditions of our Earth. 

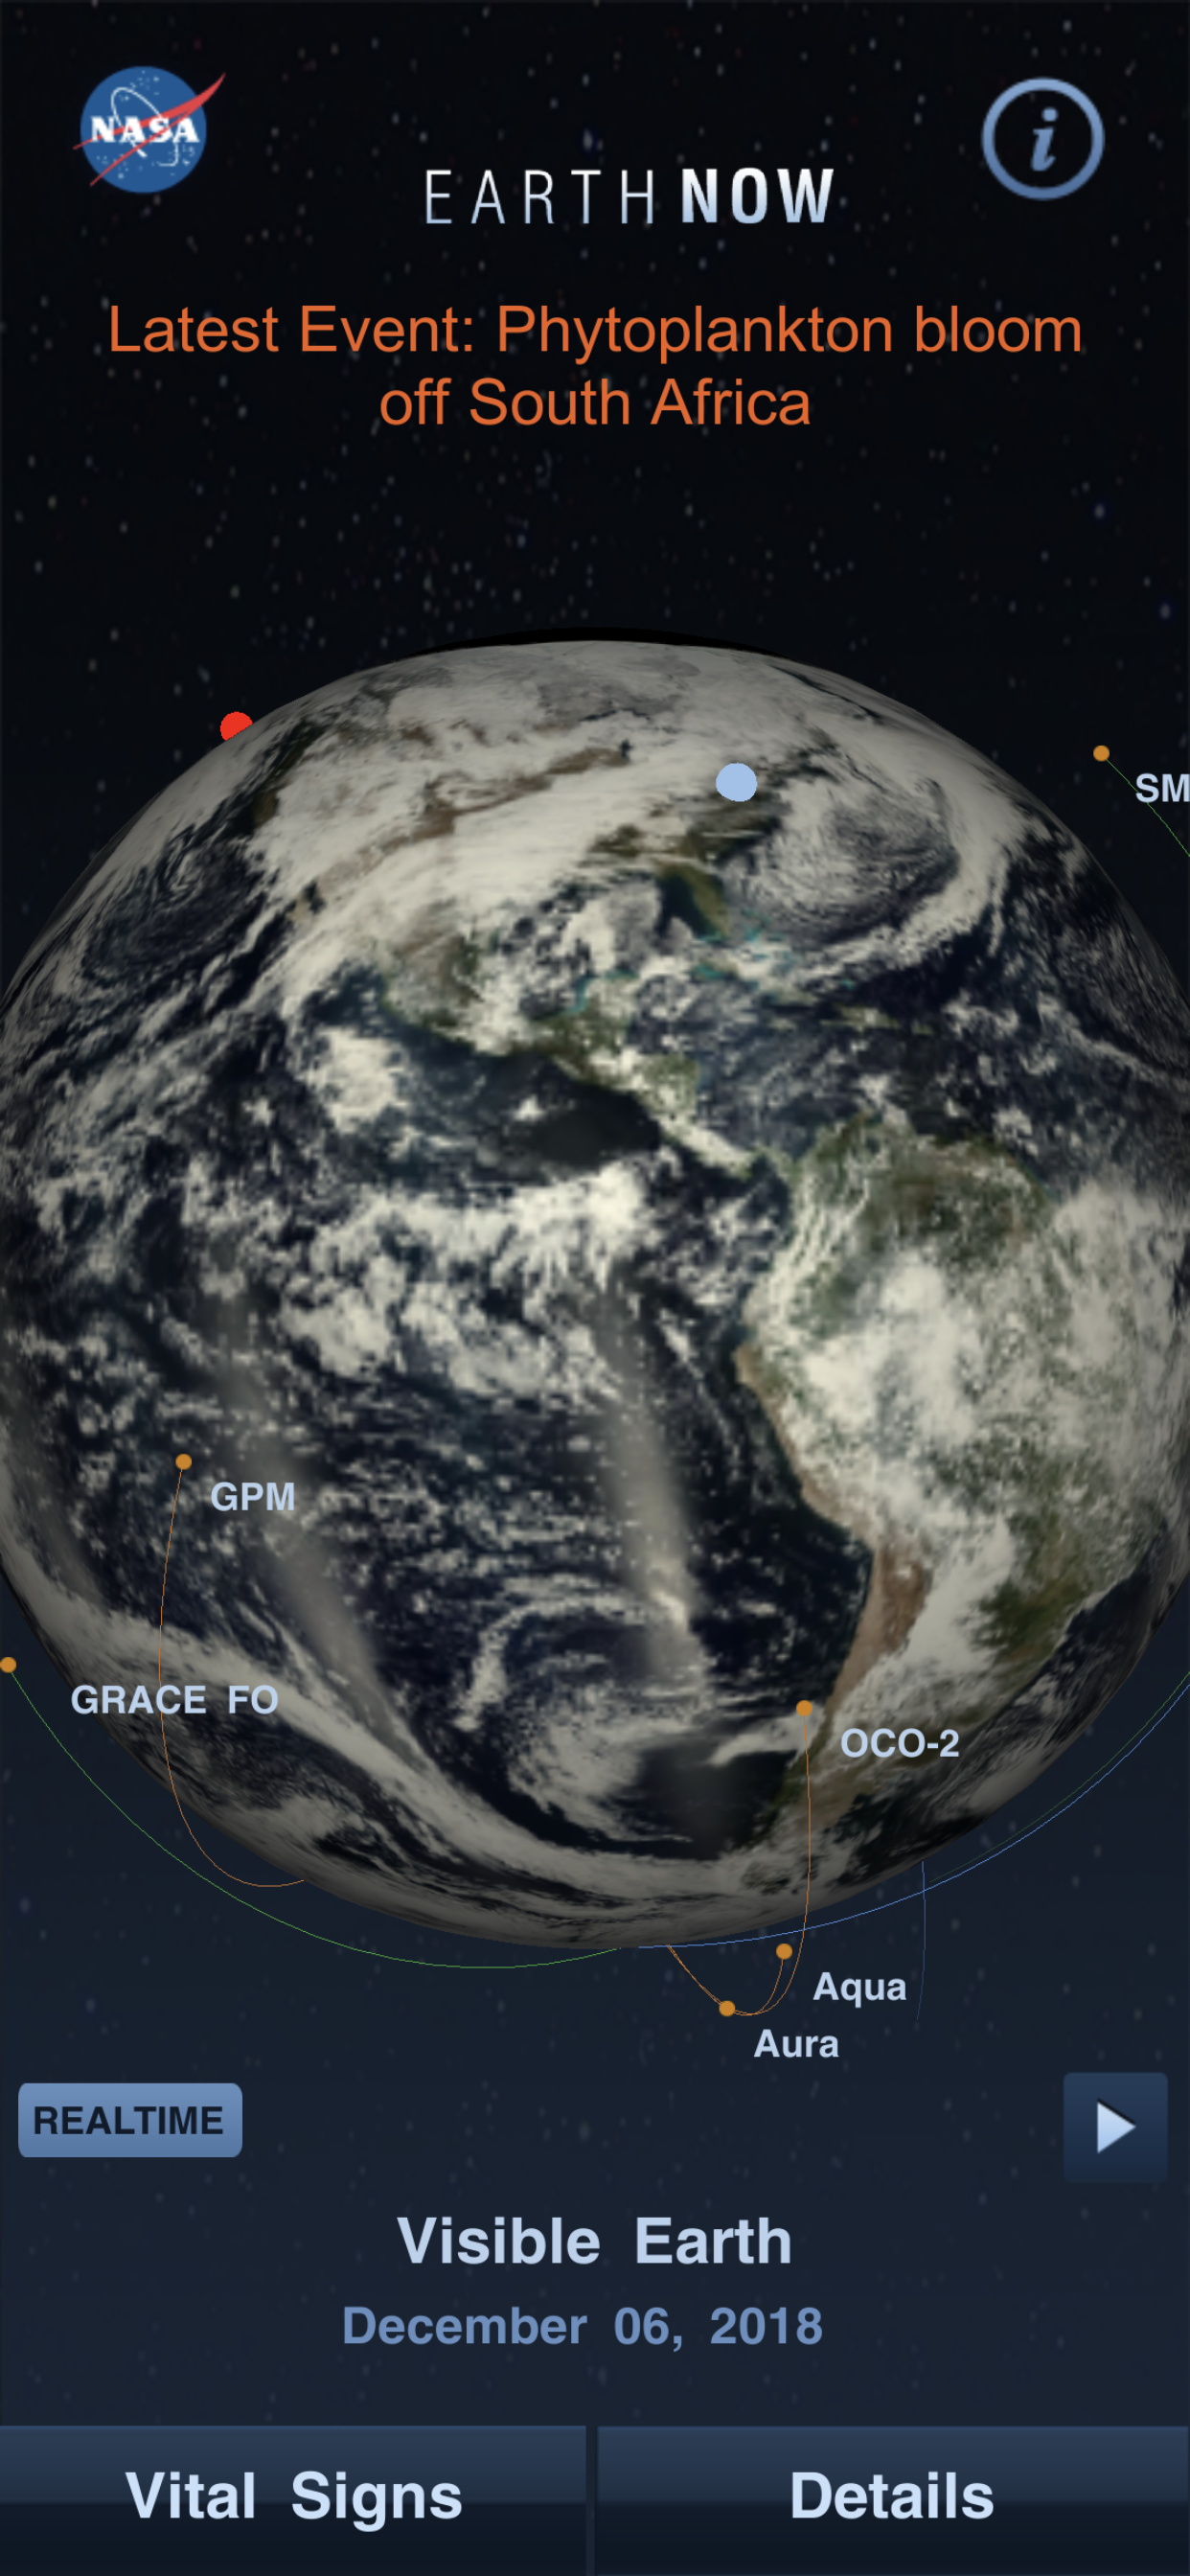
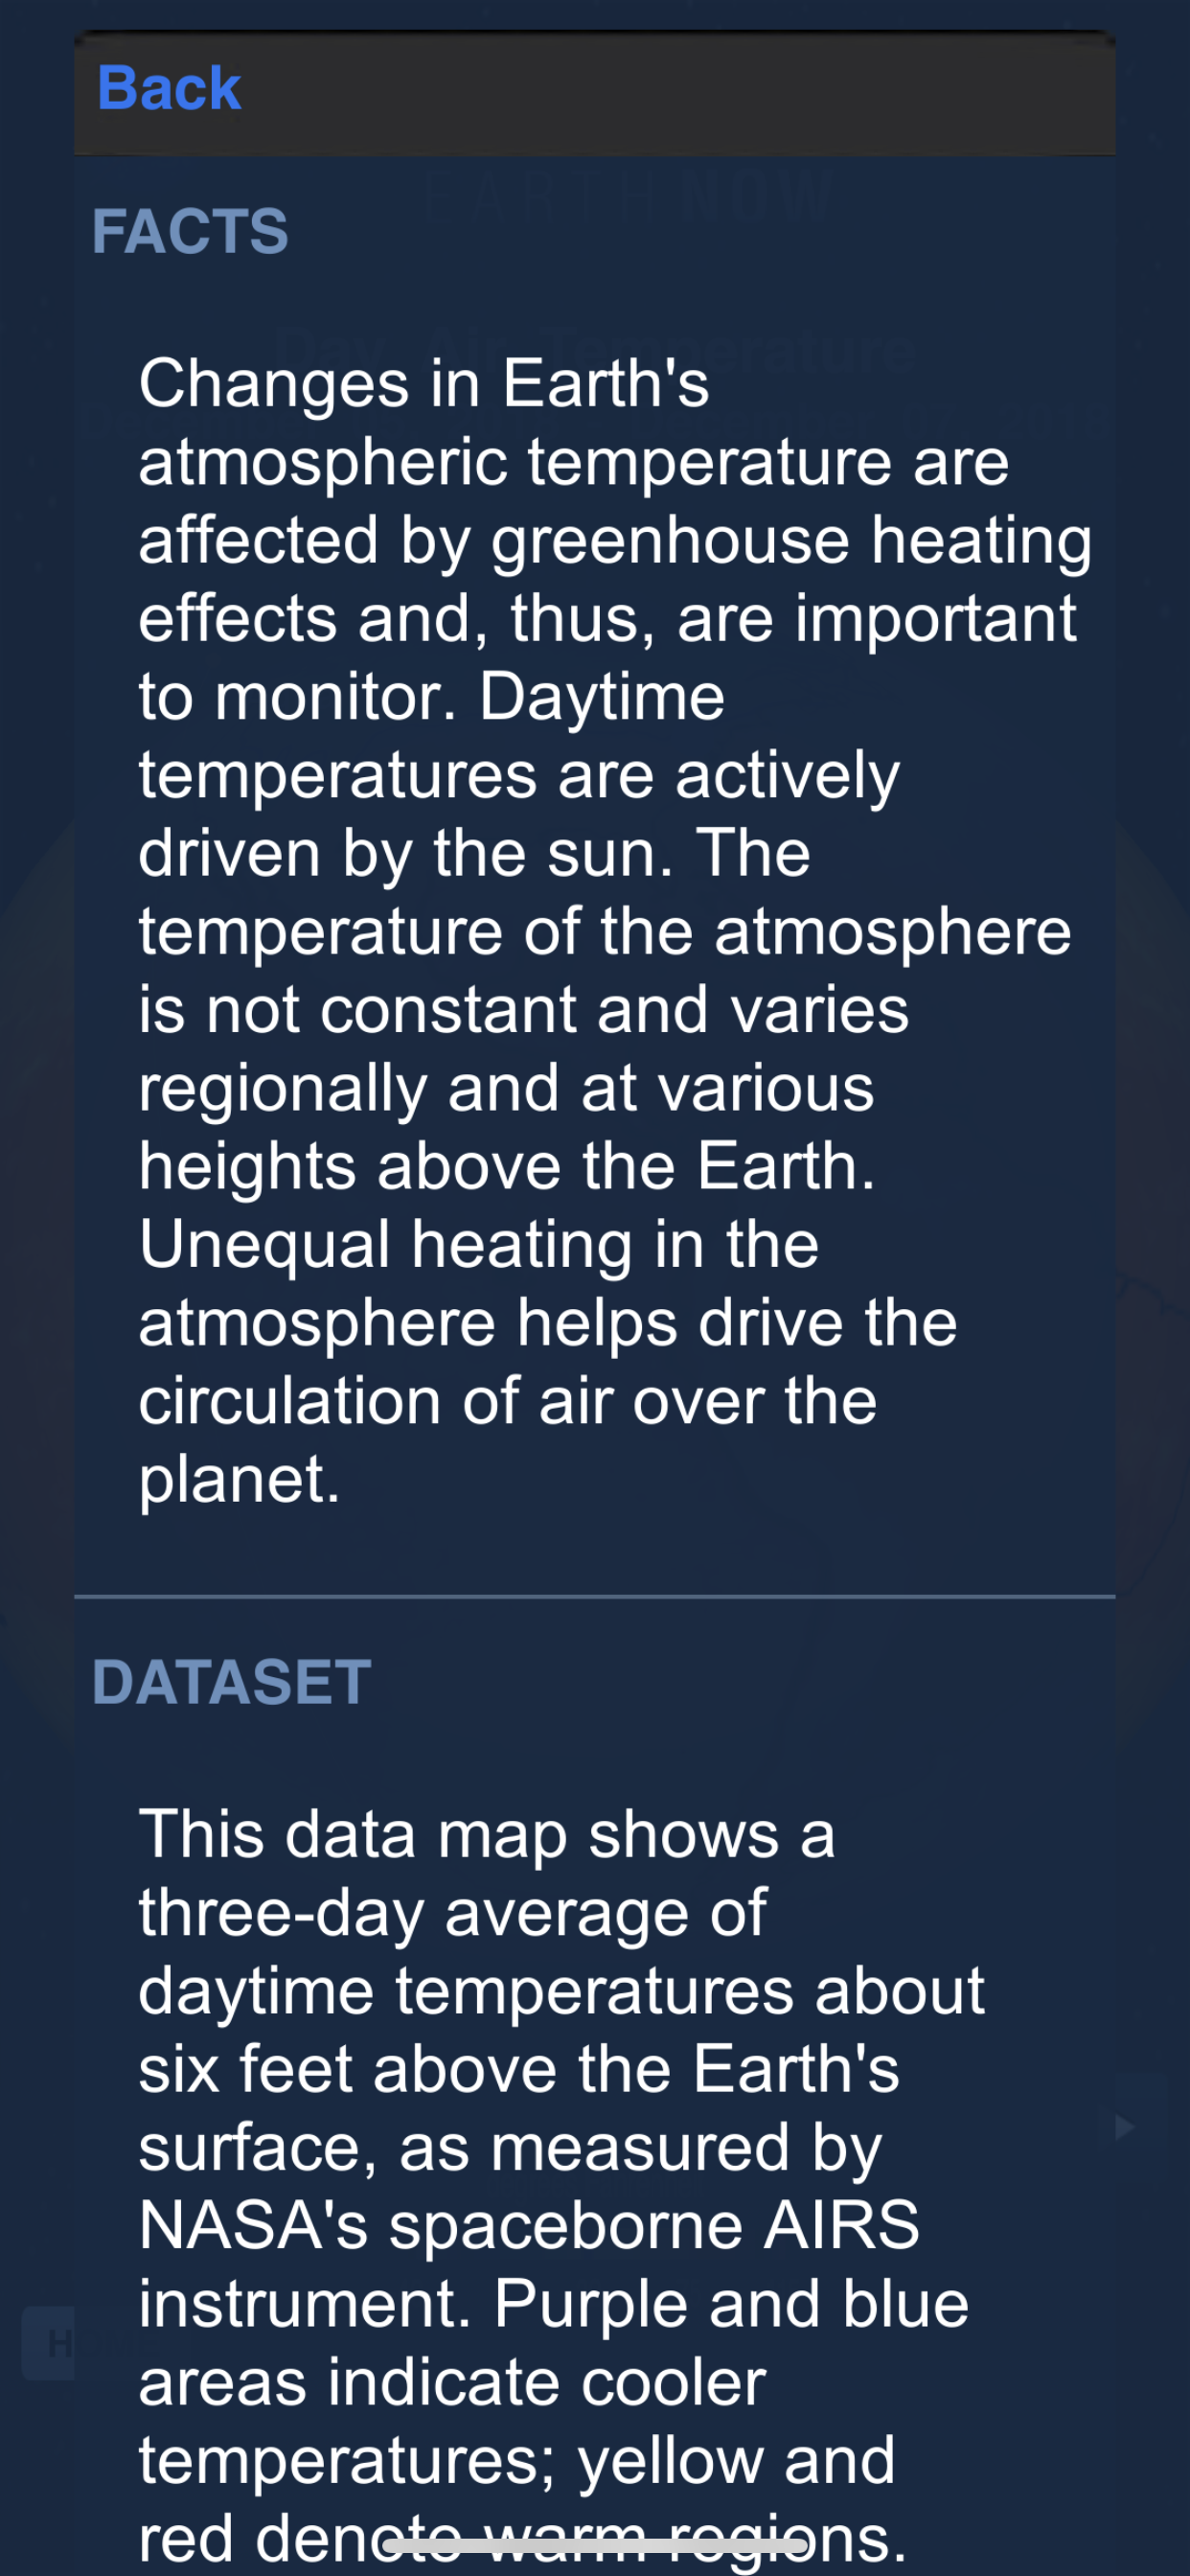
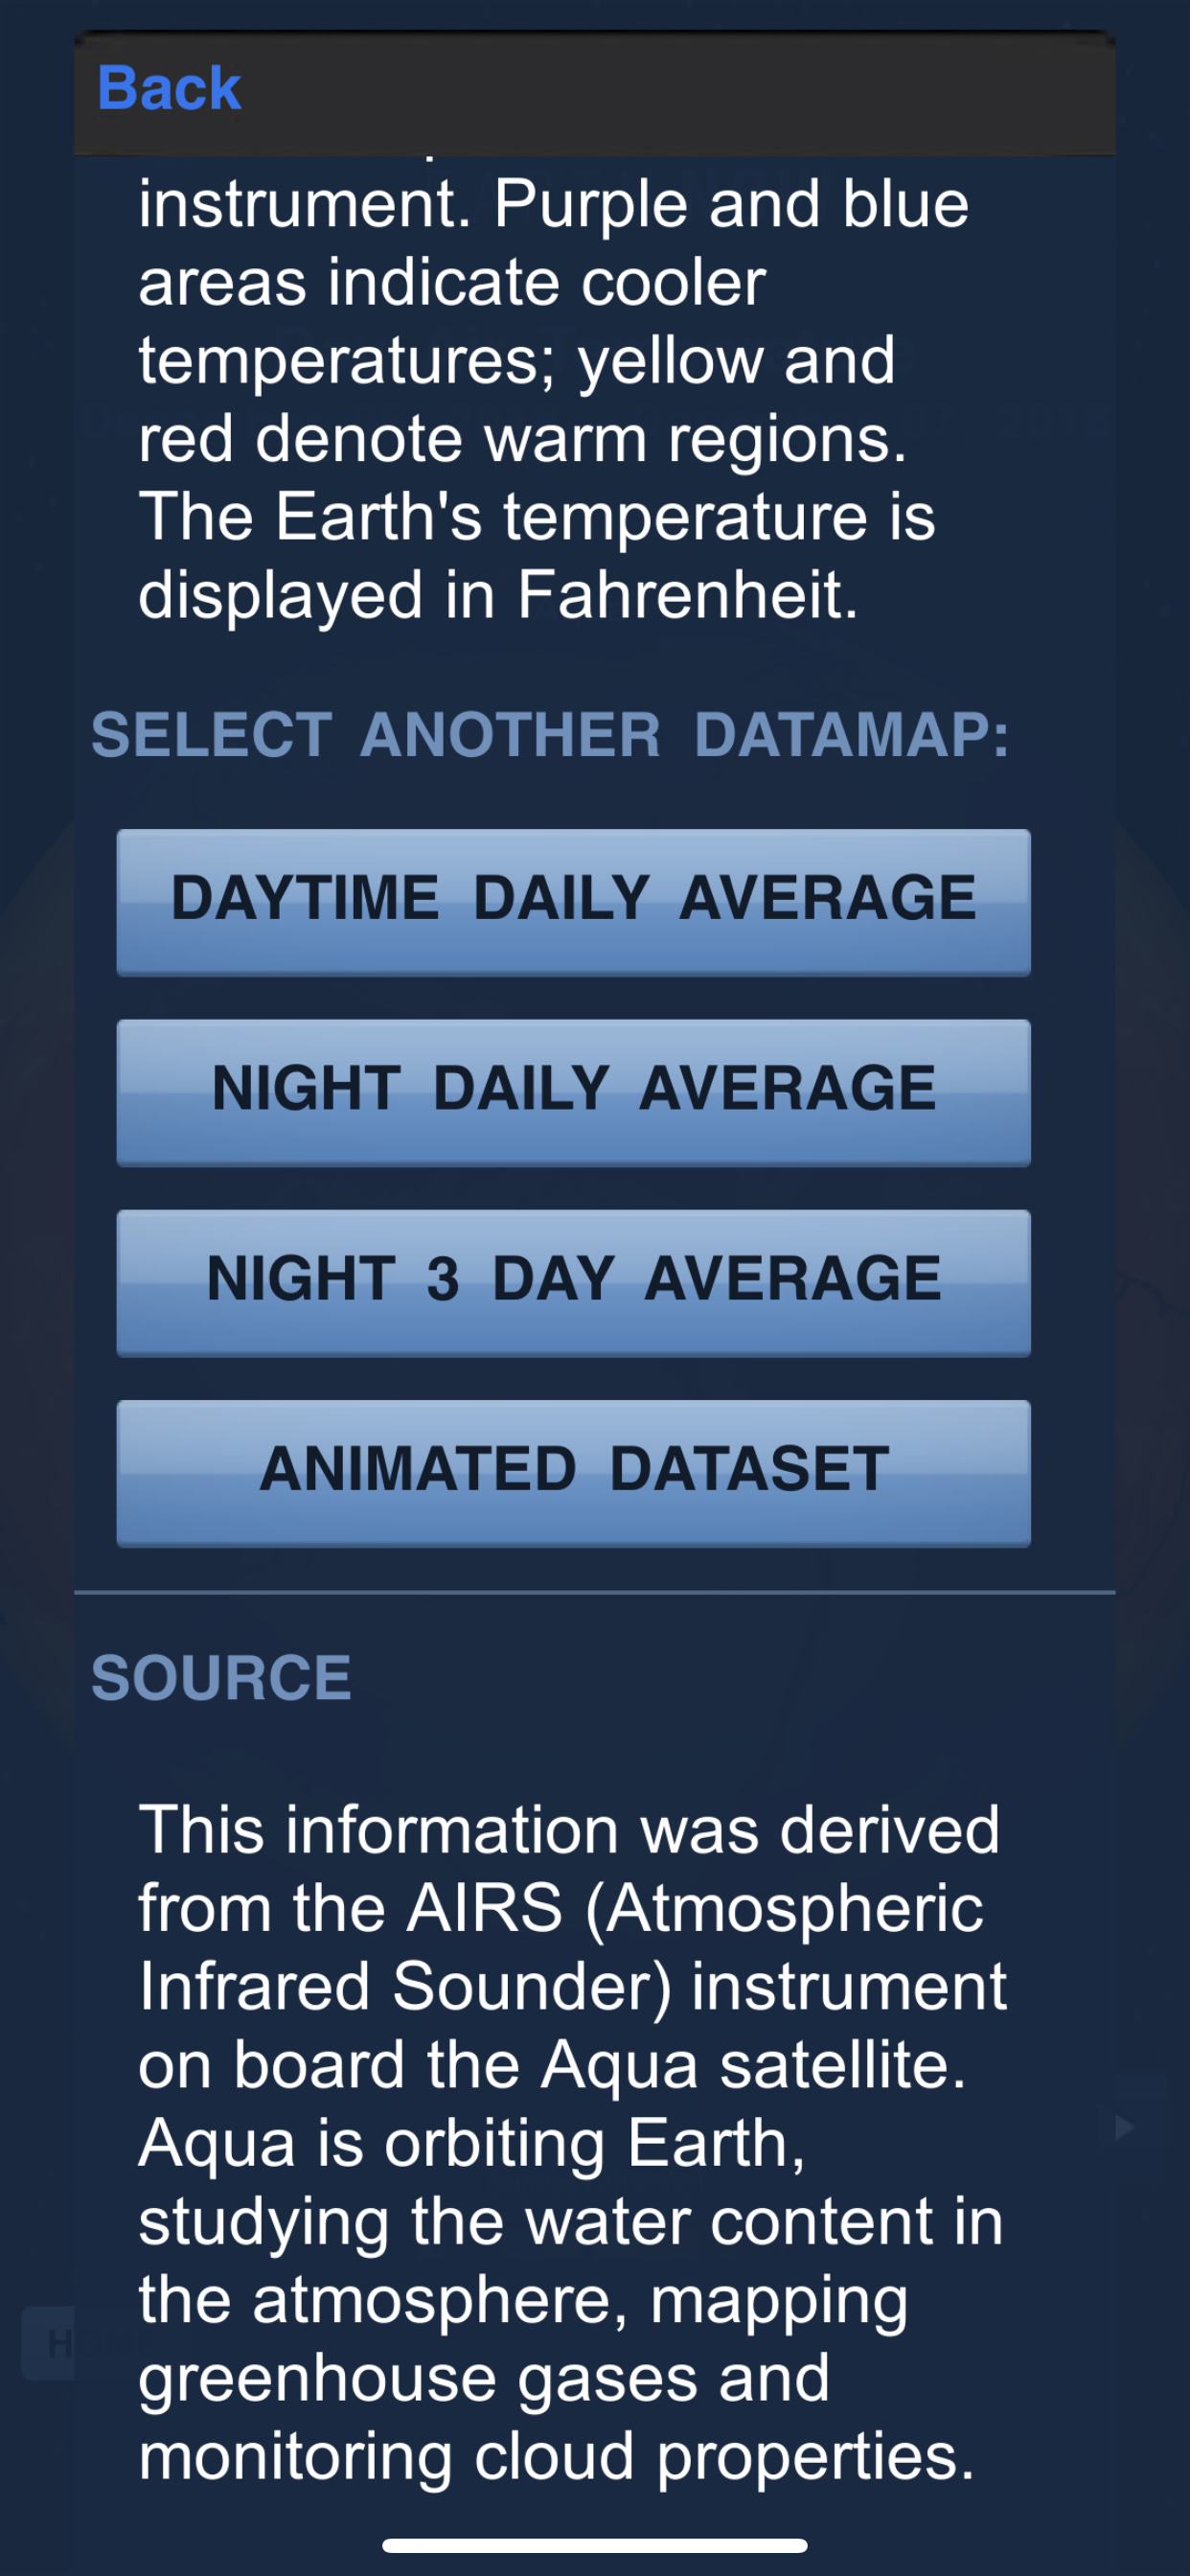
I have posted screenshots from my phone of Sea Level Variation and Day Air Temperature. The third photo shows the Earth when you open the app, and it has its latest event: Phytoplankton bloom off South Africa. It also provides further information about each environmental condition and other options for viewing the data.

Tap Water Database

The Environmental Working Group (EWG) has developed an online tool called “EWG Tap Water Database” to help Americans easily access information about their drinking water. The website allows you to put in your zip code to find the surrounding tap water systems in your area. When you click on your tap water system, you can find out information such as the amount of contaminations detected above health guidelines, what the contaminants are, and how these contaminants can affect your health.

This website is beneficial because many people may not know about the possibility of contaminants in their drinking water. The database provides not only information about the health effects that can occur from drinking the water, but also compares this data on a national scale by providing EPA guidelines. This website relates to our hydrosphere unit as well as climate change because as pollutants continue to plague our waters it is important to know whether the water we are drinking is truly safe. As we have seen in presentations given in our class, water quality is an issue that is plaguing not only the U.S. but the entire world. Websites that provide useful information such as this would be beneficial to monitoring these contamination levels and promoting awareness for those who may not know about water contamination.

National Geographic Biosphere

For those interested in learning more about the biosphere, National Geographic’s page on the Biosphere provides a plethora of useful information. This could be a tool utilized by geographers as a reference, particularly for those who either are just beginning In their field or those who are interested in becoming geographers. The page begins by defining the biosphere, which is made up of the parts of earth where life exists. The webpage is broken up into three parts. It begins with an introduction, followed by information regarding the origin of the biosphere, and concluding with information regarding the biosphere reserves. Another useful tool the site provides is a vocabulary tab, which defines various key words which are used throughout page.


NASA – State of the Ocean

NASA has created an online tool called “State of the Ocean”. This tool displays an interactive map of the world’s oceans populated with data collected from satellites. Users can select which data is being presented on the map to learn about variables like temperature, currents, and salinity. For variables with years of data collection, users can select specific date ranges to view change in one variable in a particular time frame. For example, if I wanted to observe changes in surface temperature off the coast of Vietnam between 2012 and 2014, I could easily do so and even create an animation so the map will visually change. This tool is useful for oceanographers who use this data and it’s fun to use.

Earthquake in Alaska

Claudia Ajluni

In the News #3- Lithosphere

This website, Live Science, covers scientific discoveries from a broad range of fields. There are sections for technology, health, earth, animals, etc. so there is a little bit of something for everyone. I chose to look at recent news articles in the Planet Earth section, and found an interesting article from 11/30 about an Earthquake in Alaska. The earthquake was initially reported by the U.S. Geological Survey as having a 6.6 magnitude, but it was later updated to 7.0. The photos of the damage were astounding, and it relates directly to our previous studies about the lithosphere and the causes and consequences of earthquakes. It is much more interesting reading about earthquakes when you have an understanding of why they are happening. The article then goes on to discuss the aftershocks that were occurring in the region and gives an overview of how earthquakes happen. This article is obviously very relevant to what was on our previous test about the processes that take place beneath Earth’s crust. This site was also very informative, and I highly recommend that you guys check it out. It seems to have a little bit of something for everyone, and I plan to explore it later on!

https://www.livescience.com/64206-earthquake-anchorage-alaska.html

NASA Climate Change

Nasa has a really neat website solely devoted to climate change. The website is super easy to navigate, and explains a lot of issues regarding climate change. They separate the website into 6 categories; facts, articles, solutions, explore page, resources, and Nasa science.  Under the facts sub section, the user can find information on climate change evidence, causes, and effects. They have several mitigation efforts under solutions, as well as news articles that pertain to climate change. The main visual on the homepage of the website is a carousel of 5 stories that are relevant in the news. Under this, there is a “cheat sheet” of different statistics relating to climate change, such as global temperature has increased by 1.8 degrees fahrenheit since 1880. You can click on these fact to expand them for further information and visuals. They also have a question/answer portion of the website, which I found to be really helpful. I would reccomend exploring this website if you want to take a deeper dive into climate change! Follow this link: https://climate.nasa.gov/  

Volcanoes: All Day, Every Day

https://www.volcanodiscovery.com/home.html

Volcano Discovery represents a tour company that offers expeditions to observe and study active volcanoes all around the world. However, the site has also come to be a hotbed of information, data, photos, videos, and first-person accounts of recent volcanic eruptions. The page I found most to be the most interesting was the continuously updated and interactive map that tracks all of Earth’s volcanic eruptions, no matter how small. Until I accessed this page I had no idea about the high frequency at which volcanic eruptions occurred around the world.

There is also a page that provides access to webcams depicting live footage of over 200 active volcanoes. Some volcanoes have as many as 37 different feeds (like Mt. Etna, Europe’s largest and most active volcano), while others only have 1, but they all offer a unique look into different kinds of volcanoes, fissures, hydrothermal fields, lava domes, and a variety of other lithosphere phenomena.

Volcano Discovery’s “Photo of the Day,” on 2 Dec 2018. Photographer Ingrid Smet.


Save the Sound

Save the Sound is a website dedicated to the waters of the Long Island Sound in New York and Connecticut. The Sound is an estuary ecosystem with a watershed that extends more that 16,800 square miles into Canada. However, the waters of the Sound face constant pressures from human activity throughout New England and Eastern New York. Save the Sound has been dedicated to the restoration, protection and preservation of the sound for over 40 years. The organization have programs dedicated to stopping pollution, restoring fisheries and habitats, defending drinking water and protecting the climate and air. Every year they have coastal cleanups that engage thousands of citizens to clean up marine debris. Save the Sound is a huge promoter of citizen scientists to monitor water quality and help them with their clean up efforts. Save the Sound encourages individuals who live around the Sound to become members or volunteer to the organization. They also work with schools and other organizations to create fundraisers and organize beach cleanups and educate people about how to help restore the Long Island Sound. Currently, they are working on a project to conserve Plum Island, an island that is the largest site for sea-gulls in New York and a habitat for 220 different bird species. In a 2009 act of Congress the Federal Government decided to put Plum Island up for auction. Save the Sound has gathered over 100 organizations to file a federal lawsuit and stop the sale of the island. Save the Sound is an organization that encourages people who leave near the Sound and use its resources on a daily basis to fight for their land and help restore it. Check out their website to learn about all of the initiatives they have in place to restore and save the Long Island Sound!

Image by Save the Sound

The New York Times: Geography

If you are interested in staying up-to-date on all the news concerning geography, visit The New York Times Geography website. This website is a section of The New York Times providing information and news about geography. It is a great way to learn about recent advancements in geography and read about geographical commentary and archival articles published in The New York Times. This section of the reliable news sources allows visitors to explore various areas of geography. The articles published on this website engages readers by relating geography to everyday life through interactive maps and connecting one’s community to geography. This website, which is a tool for geographers, is integral to understanding the context in which geography is applicable. To find out more about The New York Times Geography, visit https://www.nytimes.com/topic/subject/geography.

Shark Attack Data

Shark Attack Data is a cool website that complies human and shark interactions around the world. It logs shark attacks by either provoked, unprovoked, fatal, or non-fatal. It describes each attack by date, location, type and size of shark, and the activity the person was doing at the time of the incident. The main goal of the website is to increase understanding, and to promote informed discussions on shark attacks. The data comes from the Global Shark Attack File and is compiled by the Shark Research Institute. The website helps you understand where and how shark attacks occur and how they have changed over time on a global scale. You can click on any country to find their statics and data on shark attacks. However, there are some gaps and missing information in some of the logs, but regardless it still provides useful information.