East Africa’s Great Rift Valley: A Complex Rift System

My website came from: http://geology.com/articles/east-africa-rift.shtml

In East Africa there is an area where Earth’s tectonic forces are currently trying to create new plates by splitting apart old ones. This rift area is defined by a fracture in the earth’s surface that widens over time and thus becomes a new plate. The two main plates at play are the Nubian Plate, which makes up most of Africa and the Somalian Plate, which is the plate pulling away. Contained within the area of these splitting plates includes Kenya, Ethiopia, and Somalia.

There is an ongoing debate among scientists about how the rift has formed. The most popular model assumes that the elevated heat flow coming from the earth’s mantle is causing a pair of thermal bulges in central Kenya and areas north of Kenya. This heating process causes heats up the overlaying crust causing it to expand and fracture. The expansion further stretches the land and leads to the formation of oceanic crust, which creates the birth of a new ocean basin.

This area is represents a unique geological setting that may also provide some insight into the process of human evolution. Many early hominid fossils have been found within and around the East African Rift System. Since the structure and evolution of the rift may have created climate changes, early hominids would have needed to adapt to such changes. The alterations in climate structure may have driven humans to become bipedal and more brainy as they tried to adapt the changing environment.

Climate Nexus

http://climatenexus.org

Climate Nexus is a strategic communications organization dedicated to changing the conversation on climate and clean energy solutions in the United States.

The website features messages and communications of current events and a learning tab that looks into extreme weather, hard science, regional impacts and solutions and policies.

The goal of the website is to inform people on daily climate issues through the website subscriptions and through the twitter page. Screen Shot 2015-04-22 at 11.55.45 PM

The website is easy to use and provides the user with varied information on climate issues around the world ranging from policies to weather.

If a person chooses to subscribe to the website they receive daily emails about the top current environmental issues.

Climate Nexus is a clear concise website that educates people on environmental issues.

Breathing Earth

Need a quick summary of how our earth is changing? Do you like strange background music and outdated websites? If so, Breathing Earth is for you!

Check it out: http://www.breathingearth.net/

Breathing Earth is a simulation of real-time changes to earth’s carbon dioxide emissions and human population.  While there are many interactive websites that show facts and statistical information about carbon dioxide emissions, this website makes understanding the intensity of our CO2 outputs more relatable.  Instead of counting outputs per year, outputs are measured in real time.  While there are facts regarding specific county’s emissions and populations, the first numbers the websites show are for the entire planet.  This is important because, as they mention in the text below the map, emissions are a global issue: emissions do not just effect their country of origin.

Breathing Earth is significant to our course because it illustrates some of the anthropogenic alterations to the planet’s atmosphere.

Screen Shot 2015-04-22 at 8.28.27 PM


It’s obvious that this page has not been updated for a while (although it’s been copyrighted through 2015).  While the website creators mention that approximations may be too low, I am not surprised as their population data is five years old and their emissions data is NINE years old.  It would be interesting for them to alter their data to see how much faster our population and emissions are increasing (or perhaps decreasing, depending upon the country?).

Overall, I’d say the concept of this website is great: it’s simple and easy to understand, yet still gets the point across.   However, if you’re looking for an interactive, up to date map with some more detail, I would suggest http://www.globalcarbonatlas.org/?q=en/emissions (See Dan’s post below!).

Do you think it’s worth keeping simple maps like this when there are complex, interactive maps that have more info?

-Olivia

World Geography Games

http://world-geography-games.com

Screen Shot 2015-04-22 at 5.02.46 PM

In my opinion, our school systems do not provide students with enough understanding of our country’s geography, let alone the world’s. Most high school students wouldn’t even be able to label all 50 states on a map. Also, most Americans believe knowledge about foreign countries is useless. This mentality has largely contributed to our inadequacy in geography.

During my freshman year of high school, my AP U.S. history teacher gave us a quiz, making us label every country in Africa on a blank map. A lot of students struggled with this because of their lack of prior knowledge about the world around us. However, since middle school, I have practiced studying states and countries from a website called World Geography Games. This website allowed me to study every country in the world with a click of a button. So this quiz was a piece of cake for me.

World Geography Games helps students, geographers, and anyone motivated to practice their knowledge of the world. It provides entertaining and stimulating map games to improve geographical understanding. It is wonderful for adults, but also young children as well because of the way it presents it information.

Screen Shot 2015-04-22 at 7.11.56 PM

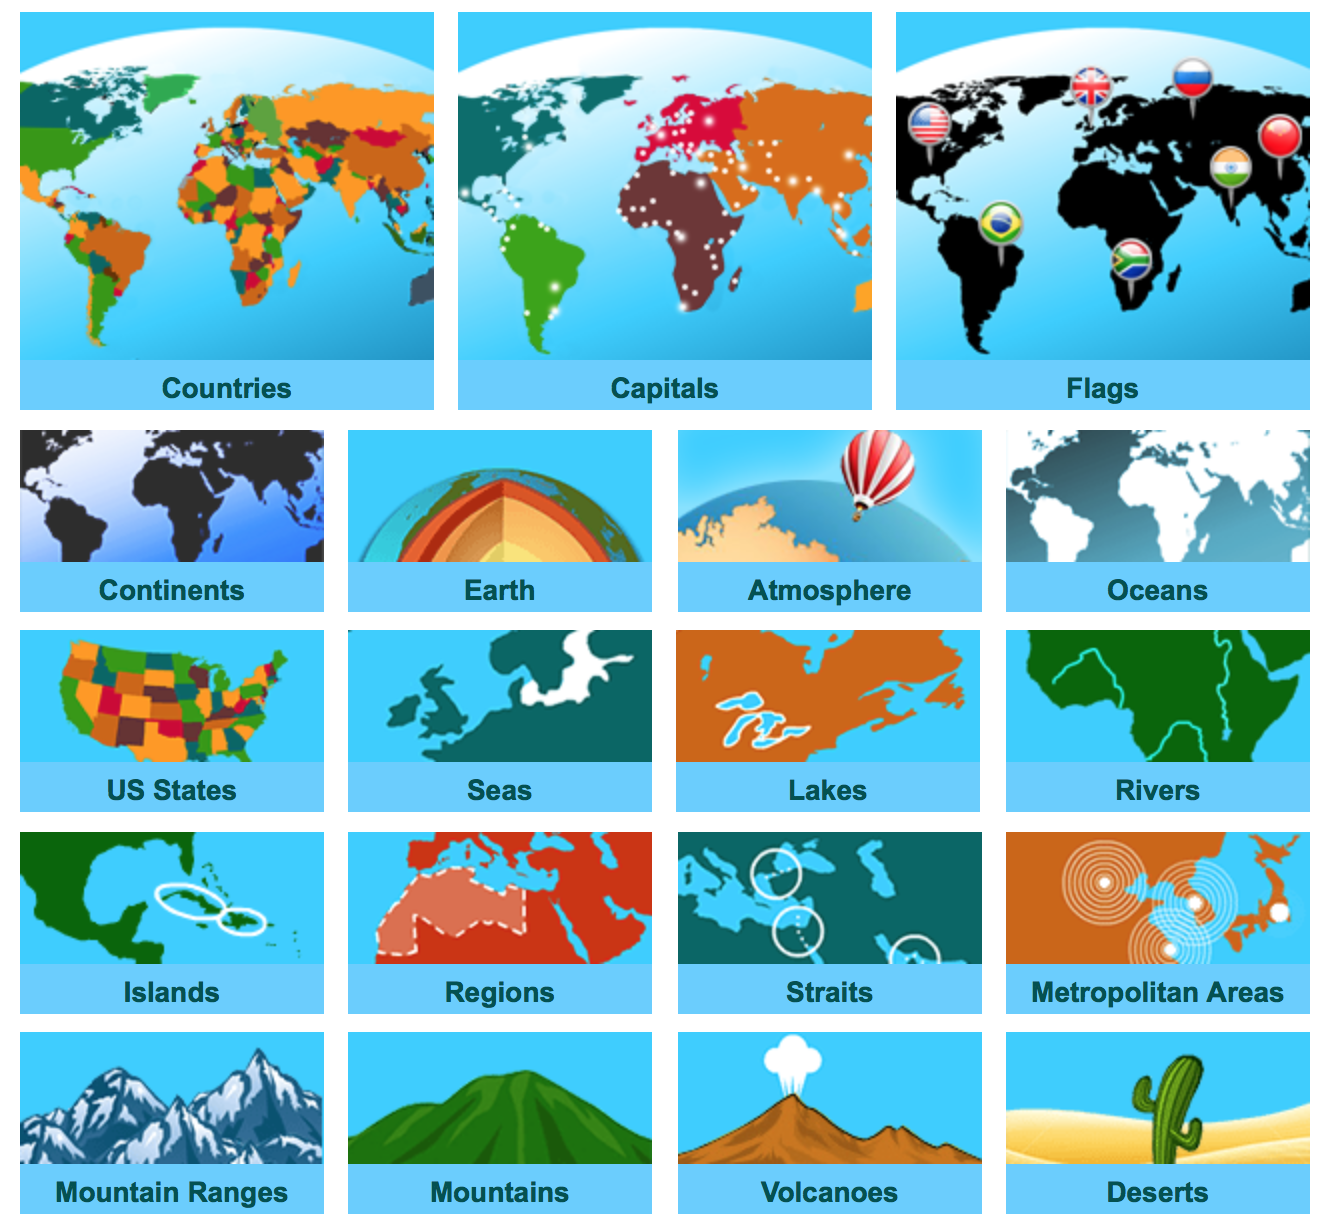
As you can see from the picture above, the website has a variety of different sections. Some are based on location, such as continents, countries, and states. Some are based on geographic features, such as mountain ranges, bodies of water, and deserts. There is even a section to learn about the Earth’s core. All the sections combined help cover the core parts of geography, bringing together geographical, political, historical, and economical knowledge.

Let me show you how it works. Say we were studying mountain ranges. The website would bring us to this page below.

Screen Shot 2015-04-22 at 5.14.07 PM

It will then begin asking you to click on certain mountain ranges. In the photo above, it is asking “Where is Serra do Mar?” You would then click on where you believe the Serra do Mar. After you are finished all of the questions, the website will give you a grade, allowing you to see how much you know about the information you are being quizzed on.

The reason this website is so effective is because it presents all of its information in the simplest terms. I wouldn’t suggest this website to anyone that has studied geography thoroughly and has deep understanding of the material since it only covers the basics. But I would suggest this website to anyone trying to learn brief knowledge about global geography.

This website relates to our Geography 250 class because it involves almost everything we have discussed. We didn’t really focus on certain countries or states, but we did focus on different types of landscape, such as bodies of water, mountain ranges, and volcanoes. We also studied the Earth’s core and the different layers of it.

After studying from this website, I believe students would be able to label all 50 states on a map and a whole lot more. Our teachers and schools need to start utilizing tools like World Geography Games if we want the next generation to better educated on global geography.

John Blair

Ecosystem Valuation

http://www.ecosystemvaluation.org/index.html

The Ecosystem Valuation website is a site that helps people who are not economist or do not have backgrounds in economy to find ways to quantify the many values provided to humans from ecosystem services. The ability to place a value on an ecosystem and the ecological functions it provides is very powerful because it allows people to see landscapes and ecosystems for their value rather than their physical attributes.

The site is broken down into six sections; purposes and uses, the big picture, essentials of ecosystem valuation, dollar-based ecosystem valuation methods, and ecosystem benefit indicators. Each section takes complicated economic theories and simplifies them for the average person.

For this post I will focus on the section titled the “Big Picture”. This section provides a great overview of why it is important to value ecosystems and a brief overview of the different ways this can be done. Each section provides examples of when it is best to use certain methods and their advantages. This section is a great place to start if you are someone who needs to place a value on a certain ecosystem or ecosystem service for a class, project, or own interest. I used this website for my senior seminar to help value coastal wetland’s ecosystem services and it was extremely helpful for someone like me who is not well versed in economics.

Screen Shot 2015-04-22 at 5.32.08 PM

-Austen

National Park Foundation

Check out http://www.nationalparks.org/explore-parks, the official website of the National Park Foundation, which is the charitable partner of the National Park Service.

If you use the search bar in the top right, you can go to a park’s page, where you can find all sorts of information about the park. For example, I searched for Yosemite and came to this page, where you can see the weather at the park, the park’s wildlife, a list of things to do while you’re there, and even a group of photos taken by visitors, like this one:

If you’re planning a visit to a national park, this website is a must-see, so that you can get the most out of your trip!


Cullen

NASA Climate Change

http://climate.nasa.gov/

The NASA website for climate change has some really cool tools. It has a wide variaty of articles, facts, extremely interesting photos, and videos.

The homepage of the website has shocking facts about climate change, and pictures that really attract your attention. There is a facts, articles, NASA’s role, explore, and solutions tab.

Screen Shot 2015-04-22 at 2.59.07 PM

Under facts you can find evidence, causes, effect, and FAQs of climate change. They use graphs, photos and videos to explain the data. The pictures are breathtaking!
Screen Shot 2015-04-22 at 3.00.01 PM

Under the explore tab, there is a section called “Images of Change”, as the name suggests these sets of images compare the before and after of landscaped. The pictures illustrate things like wildlife, sea level, glacier melt, urban development.

Screen Shot 2015-04-22 at 4.10.13 PM

Finally, “Eyes on Earth” is a program where you can see the world under different perspectives. There are heat maps of carbon dioxide, sea level, amount of ice. This tools allows you to see the parts of the world most affected by climate change, the countries with most pollution, etc.

Screen Shot 2015-04-22 at 4.11.12 PM

I loved the website! I think the do a really good job at presenting with images the current state of the world. The website presents shocking facts, that make you want to start the change! Everyone should definitely check it out!

Maria

TimeMaps History Atlas

http://www.timemaps.com/history

The World History Timeline, is a free website for people who are looking to study the history of different regions of the world from 3500 BC up until 2005 AD.

Screen Shot 2015-04-22 at 3.31.04 AM

This website, covers almost 1500 interactive map experiences in different locations of the world. It also helps easily identify the different dynasties and rulers, the civil wars and world wars, and also helps us identify the current happenings of today’s world.

Screen Shot 2015-04-22 at 3.36.27 AMScreen Shot 2015-04-22 at 3.36.39 AM

Once clicked on a particular region, the map shows a timeline of that continent and what were the major events that took place in the history of that continent or subregion.

This can be very helpful for students who can understand the history of a region or empire more clearly and visually than portrayed in books. For example, if someone wants to study the empire of rome, he can click on Europe, and go back to the Roman Civilization.

Screen Shot 2015-04-22 at 3.44.03 AM

Once a particular region has been selected during the timeline that the person wants to examine during the Roman Empire. This empire can then be thoroughly examined from topics ranging from the economy and society, to government, warfare and law, to the religion that dominated that region or the culture that prevailed. It also points out the technology and science that was created and can be accredited to that particular timeline. These information are written or cited from scholarly articles and journals, which verifies the legitimacy of the content presented to the viewers.

This makes it a good tool for history majors, as well as for people who are interested in learning the maps or geography of the region being examined. This tool, which is easily accessible and fun to play around with can be very helpful for people who just want to brush up on their history, or are really looking to find something they have been searching for all along.


Haamid Shaikh.

NatGeo Mapmaker Interactive

http://mapmaker.education.nationalgeographic.com

National Geographic has created a simple way for novice mapmakers to make interactive maps online. With a variety of subjects to choose from, users can combine different layers to make inferences about the physical geography across the globe.

Layer categories include food, climate and weather, U.S. History, water, earth systems, human populations, environment, energy, animal ranges, culture, economy, and political boundaries. Within these categories contains layers that pertain to the hydrosphere, lithosphere, atmosphere, and biosphere.

With this interactive map, it’s possible to compare variables, such as global CO2 emissions with global energy usage, to see if there is any connection between them. Another example is to look at the location of significant earthquakes with the location of plate tectonics (as shown in photo).

Screen Shot 2015-04-21 at 11.25.40 PM

In addition to the provided layers, users can create lines, polygons, rectangles, circles, markers and text to their map. Maps can also be saved for later, or printed to share.

Although this map is fairly limited in it’s capabilities, for someone who wishes to create a map, but does not know how to use GIS, this website is very useful.

You guys should all try it. It’s fun!


-Katie

FREE Geography Tools

This FREE online geography website provides interested individuals (geographers) with decent explanations and instructions on how anyone can use some very practical geographic tools. All of us in this class are fortunate to be blessed enough to attend a school like University of Richmond and learn from great infrastructures in hands on lessons and lab meetings. Not all young adults across the United States have these same luxuries. There are many people who would love to learn about the environment and the practical use of geographic tools but never get the exposure.

The website provides “useful links” accompanied by downloads to many tools we have been exposed to in our geography class. Some of these include Archaeogeek, GIS and Science, Google Earth, Google Lat Long and much more.

I particularly like this cite because the author offers explanations for beginners starting with the basics of how to read and make maps and then all the way up to professional geographers.

Here I have included a link to a video for Photo Fly: “Project Photofly is a cloud-based service that converts 2D photographs to 3D computer models. It is available as a free technology preview on Autodesk Labs. This video demonstrates how to take a series of photographs with a standard digital camera to maximize the results.”

The author also talks about fun tricks and tools that one can do with a Garmin GPS device. I was very intrigued by this because I have always been a huge fan of portable GPS devices; primarily from when I used to fish a lot. Whether I was out in the ocean or on a freshwater lake my grandfather would always save points on the GPS memory so we would know where we had luck catching fish or ran into a big school the previous day.

Two particular tools the author provides downloads for include:

1) MapSource Uploader – A program to help install OSM-based Garmin maps into MapSource/BaseCamp.

2) Route Editor – GUI to create custom Garmin routing styles

Overall this is a useful website for any interested beginner or experienced geographer.

Thanks,

Jack