
http://climate.nasa.gov/
The NASA website for climate change has some really cool tools. It has a wide variaty of articles, facts, extremely interesting photos, and videos.
The homepage of the website has shocking facts about climate change, and pictures that really attract your attention. There is a facts, articles, NASA’s role, explore, and solutions tab.
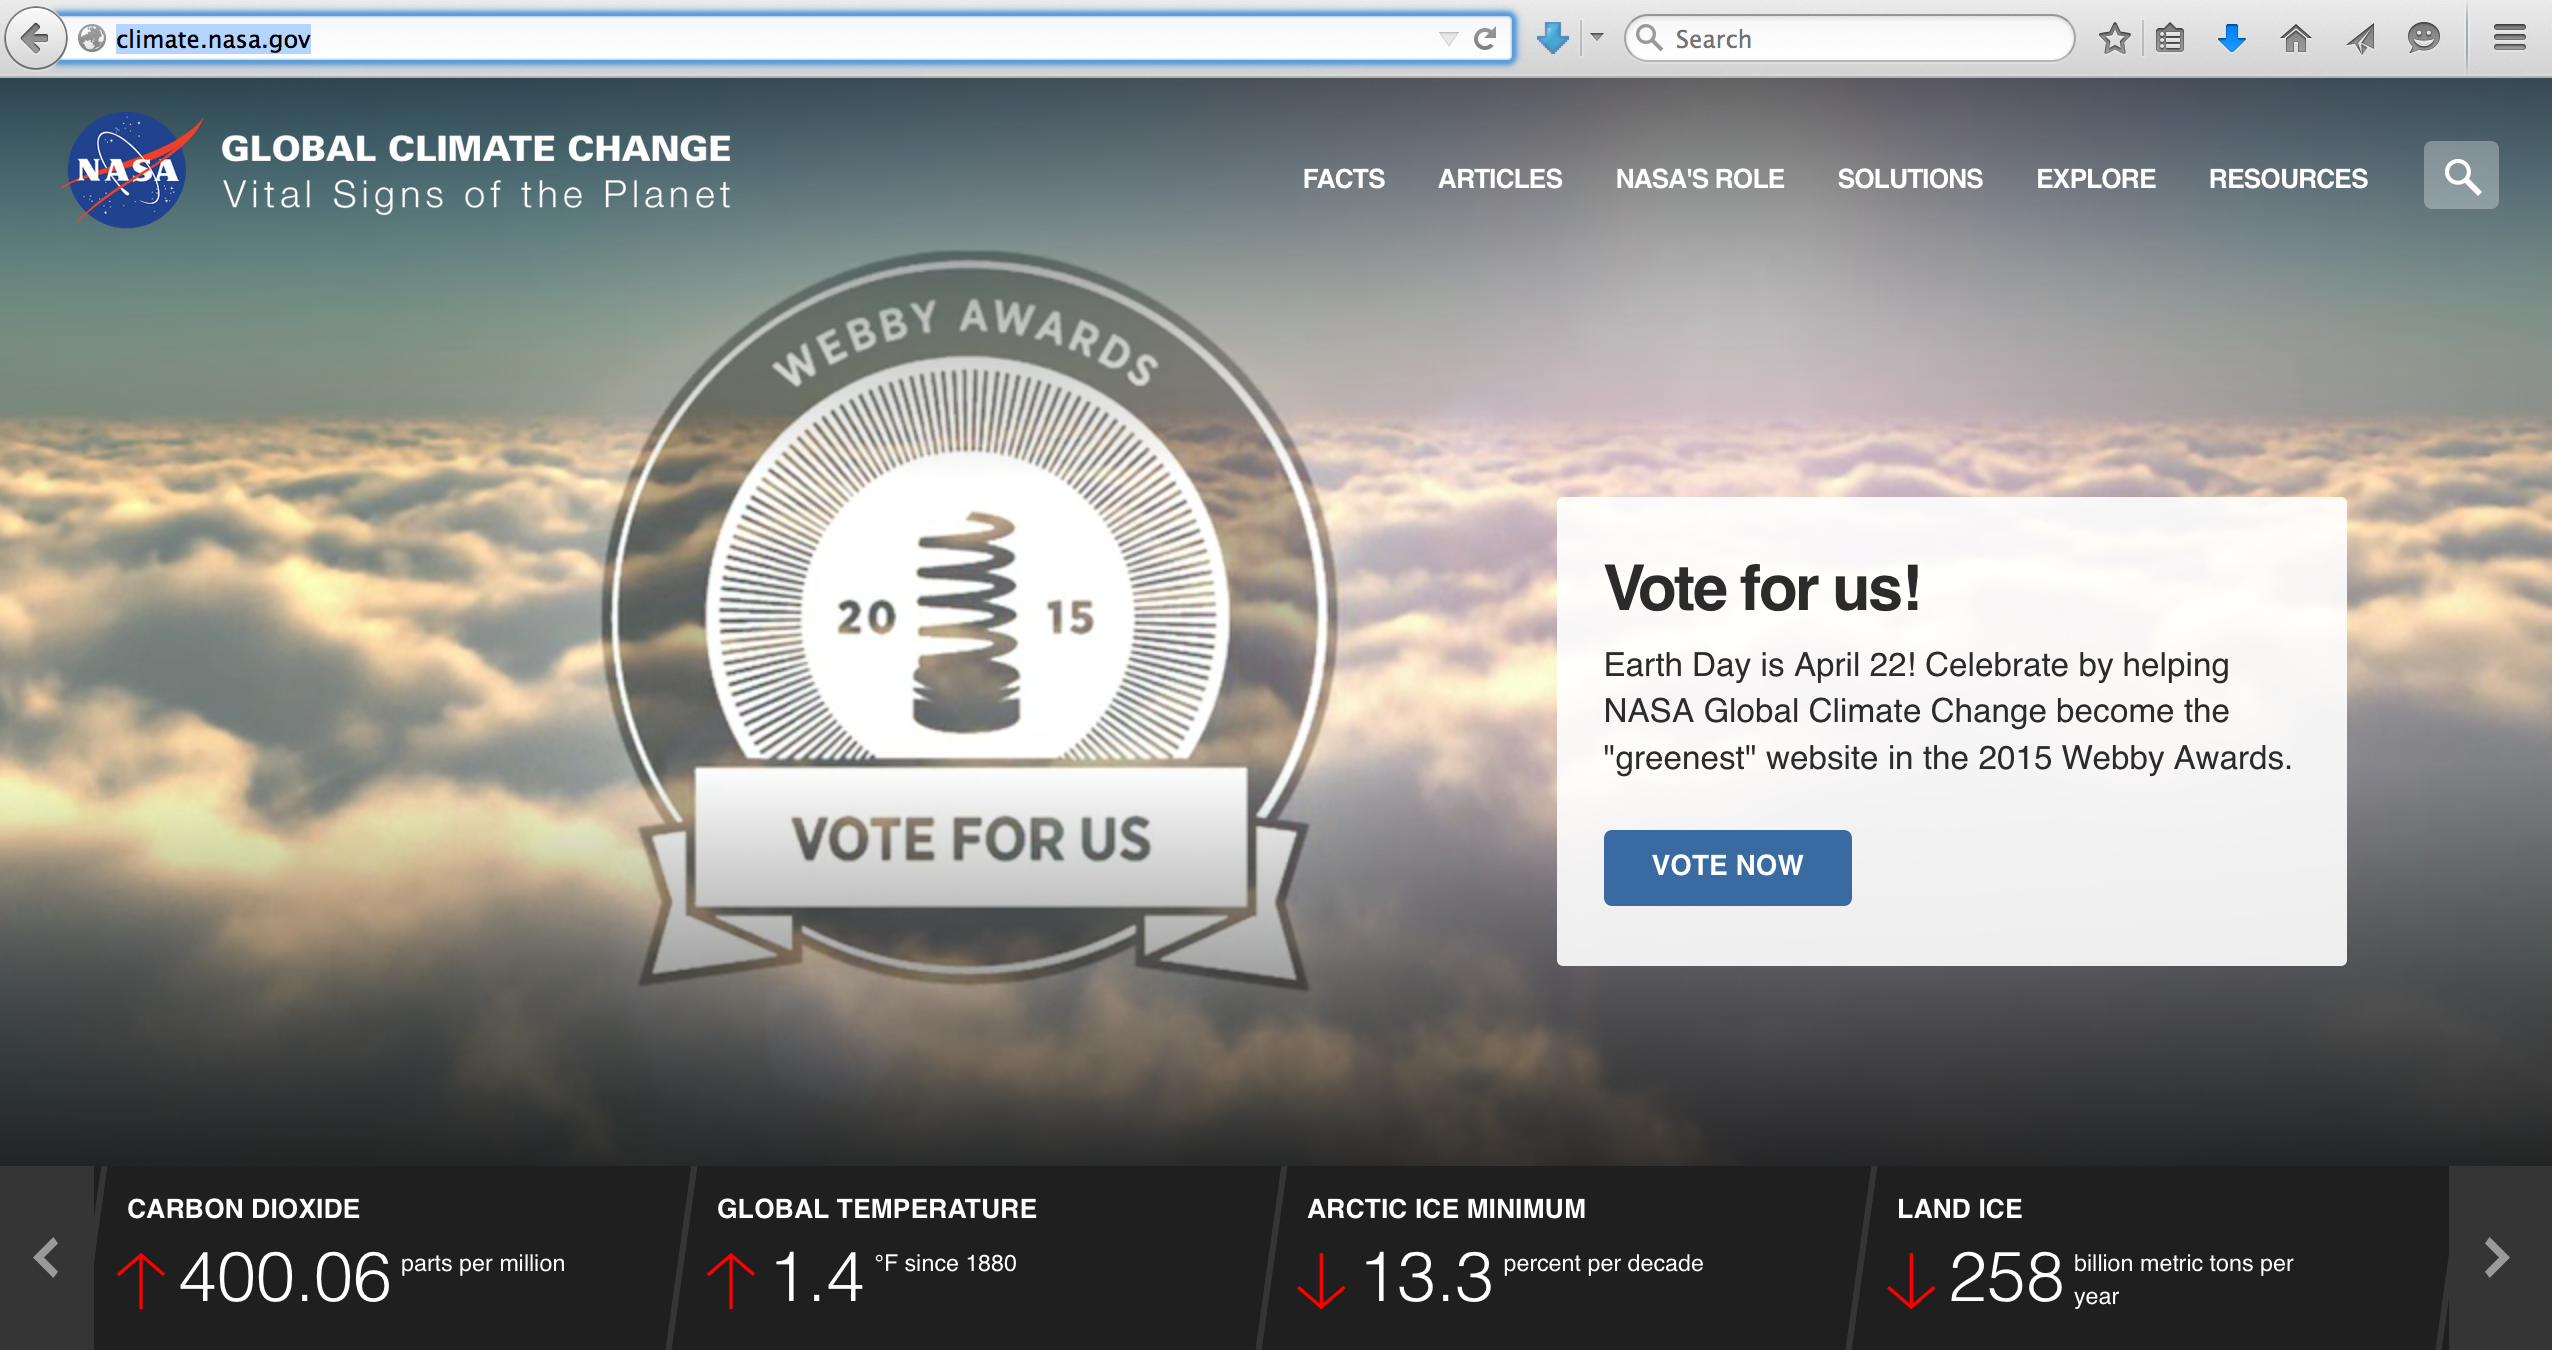
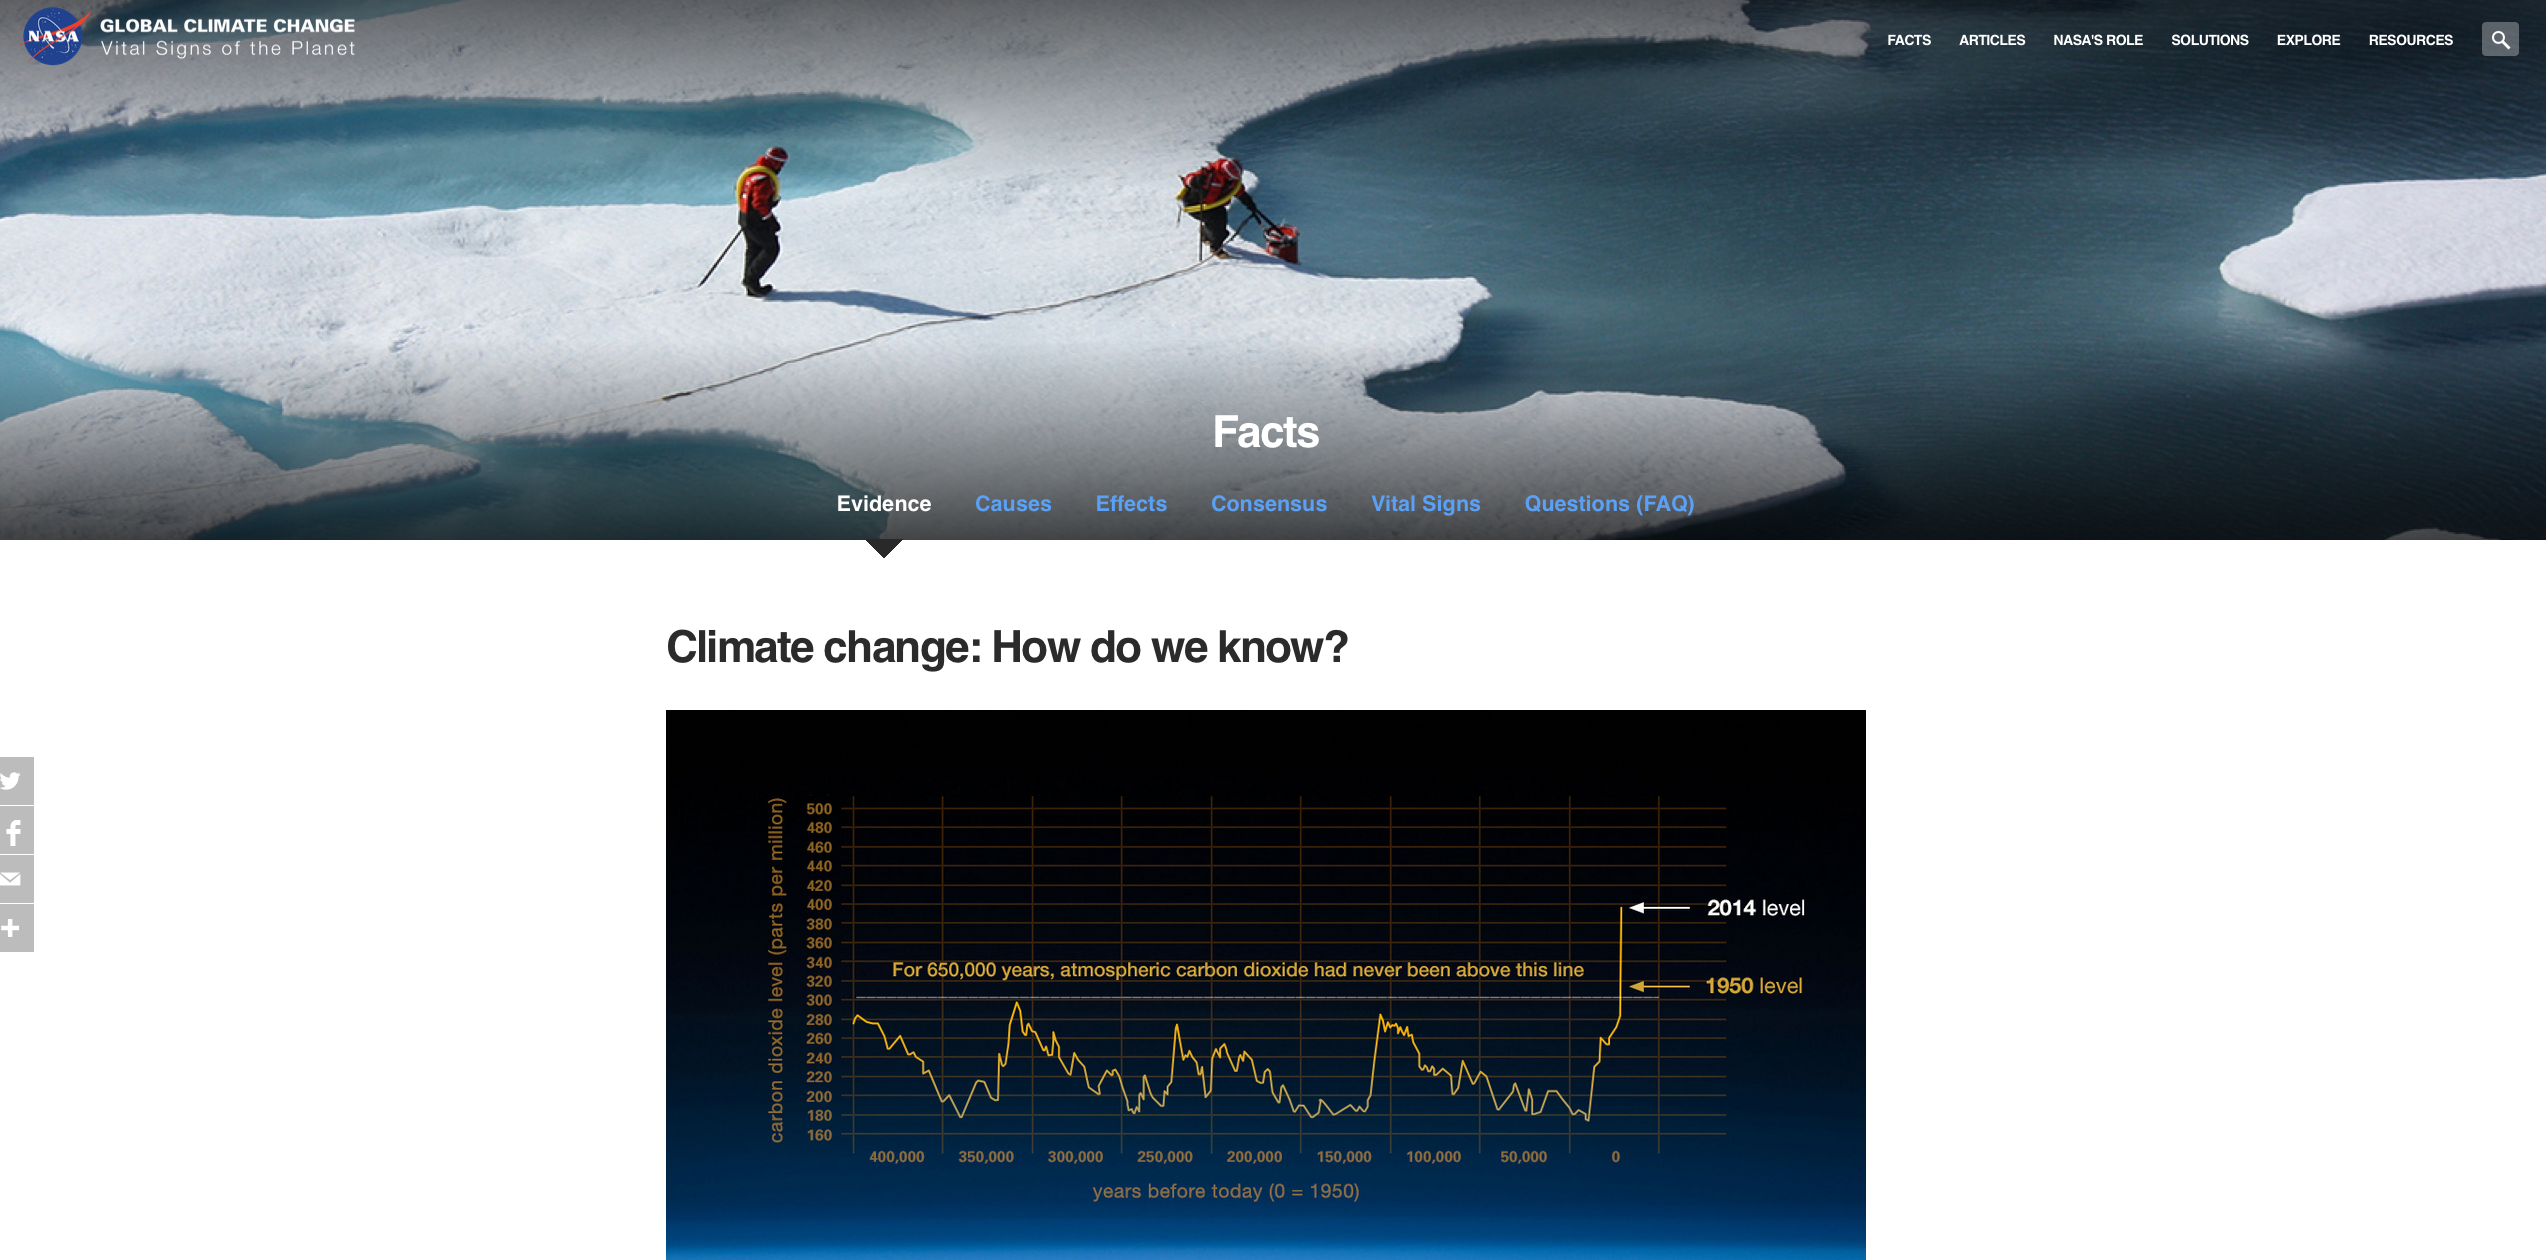
Under facts you can find evidence, causes, effect, and FAQs of climate change. They use graphs, photos and videos to explain the data. The pictures are breathtaking!
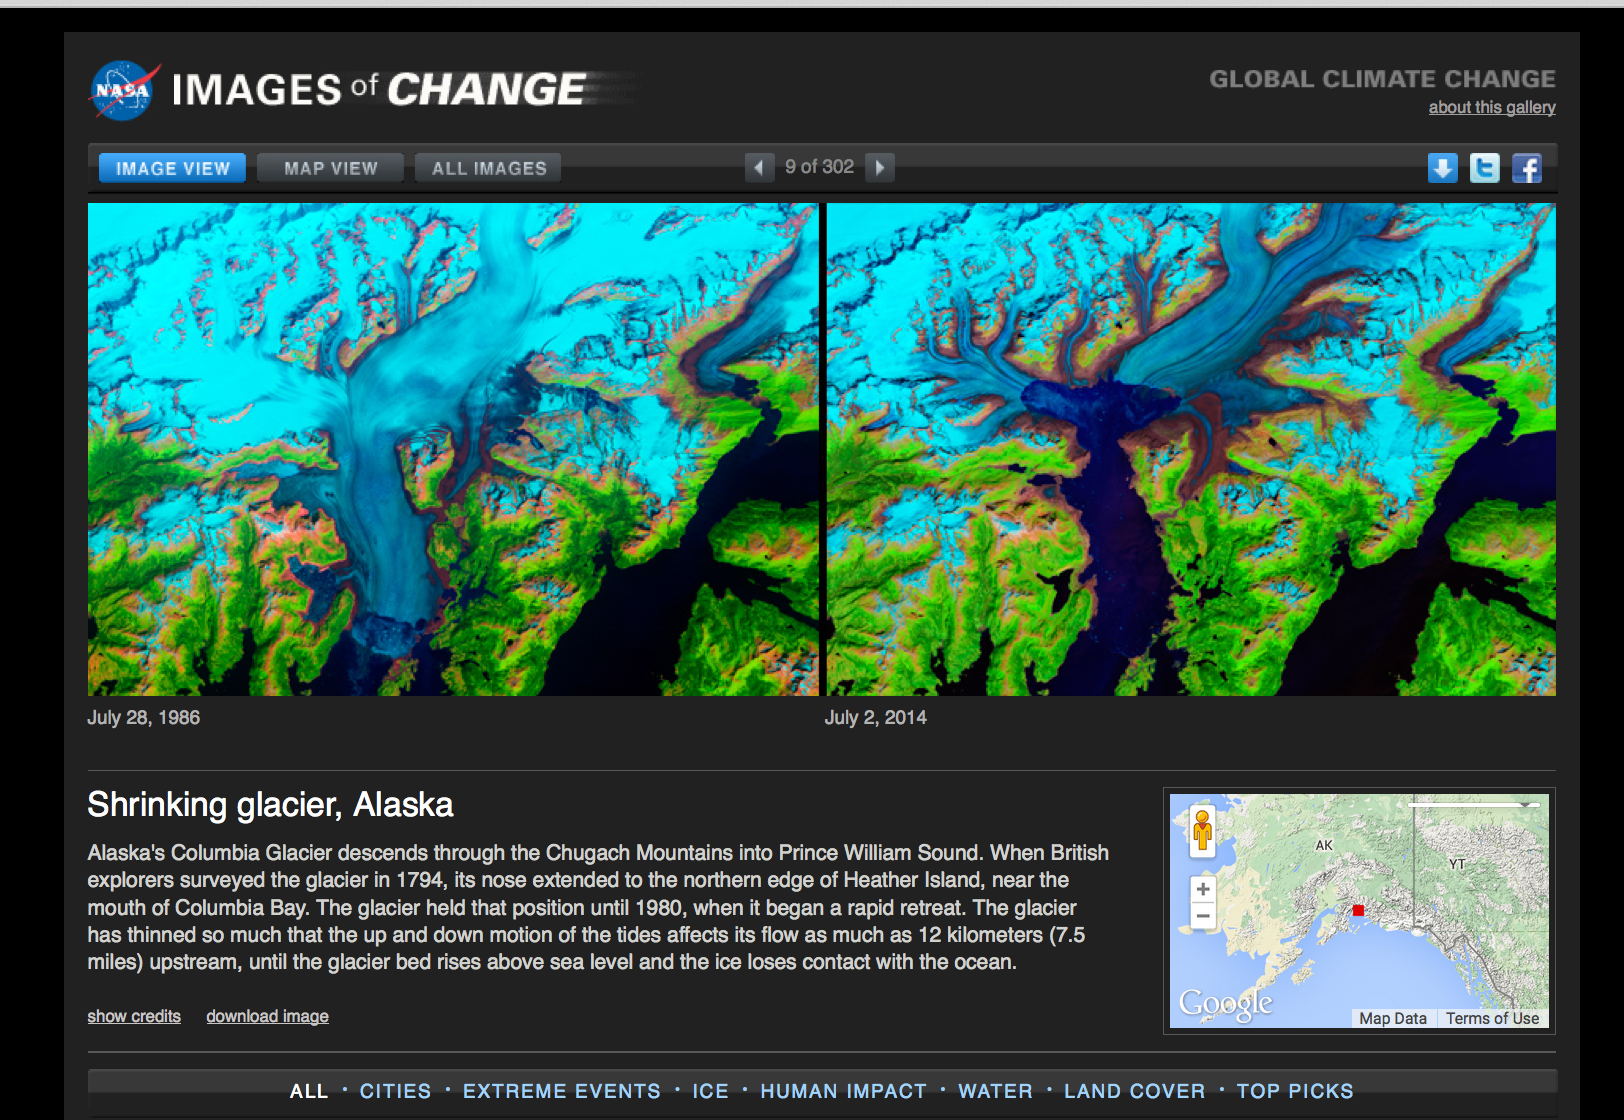
Under the explore tab, there is a section called “Images of Change”, as the name suggests these sets of images compare the before and after of landscaped. The pictures illustrate things like wildlife, sea level, glacier melt, urban development.
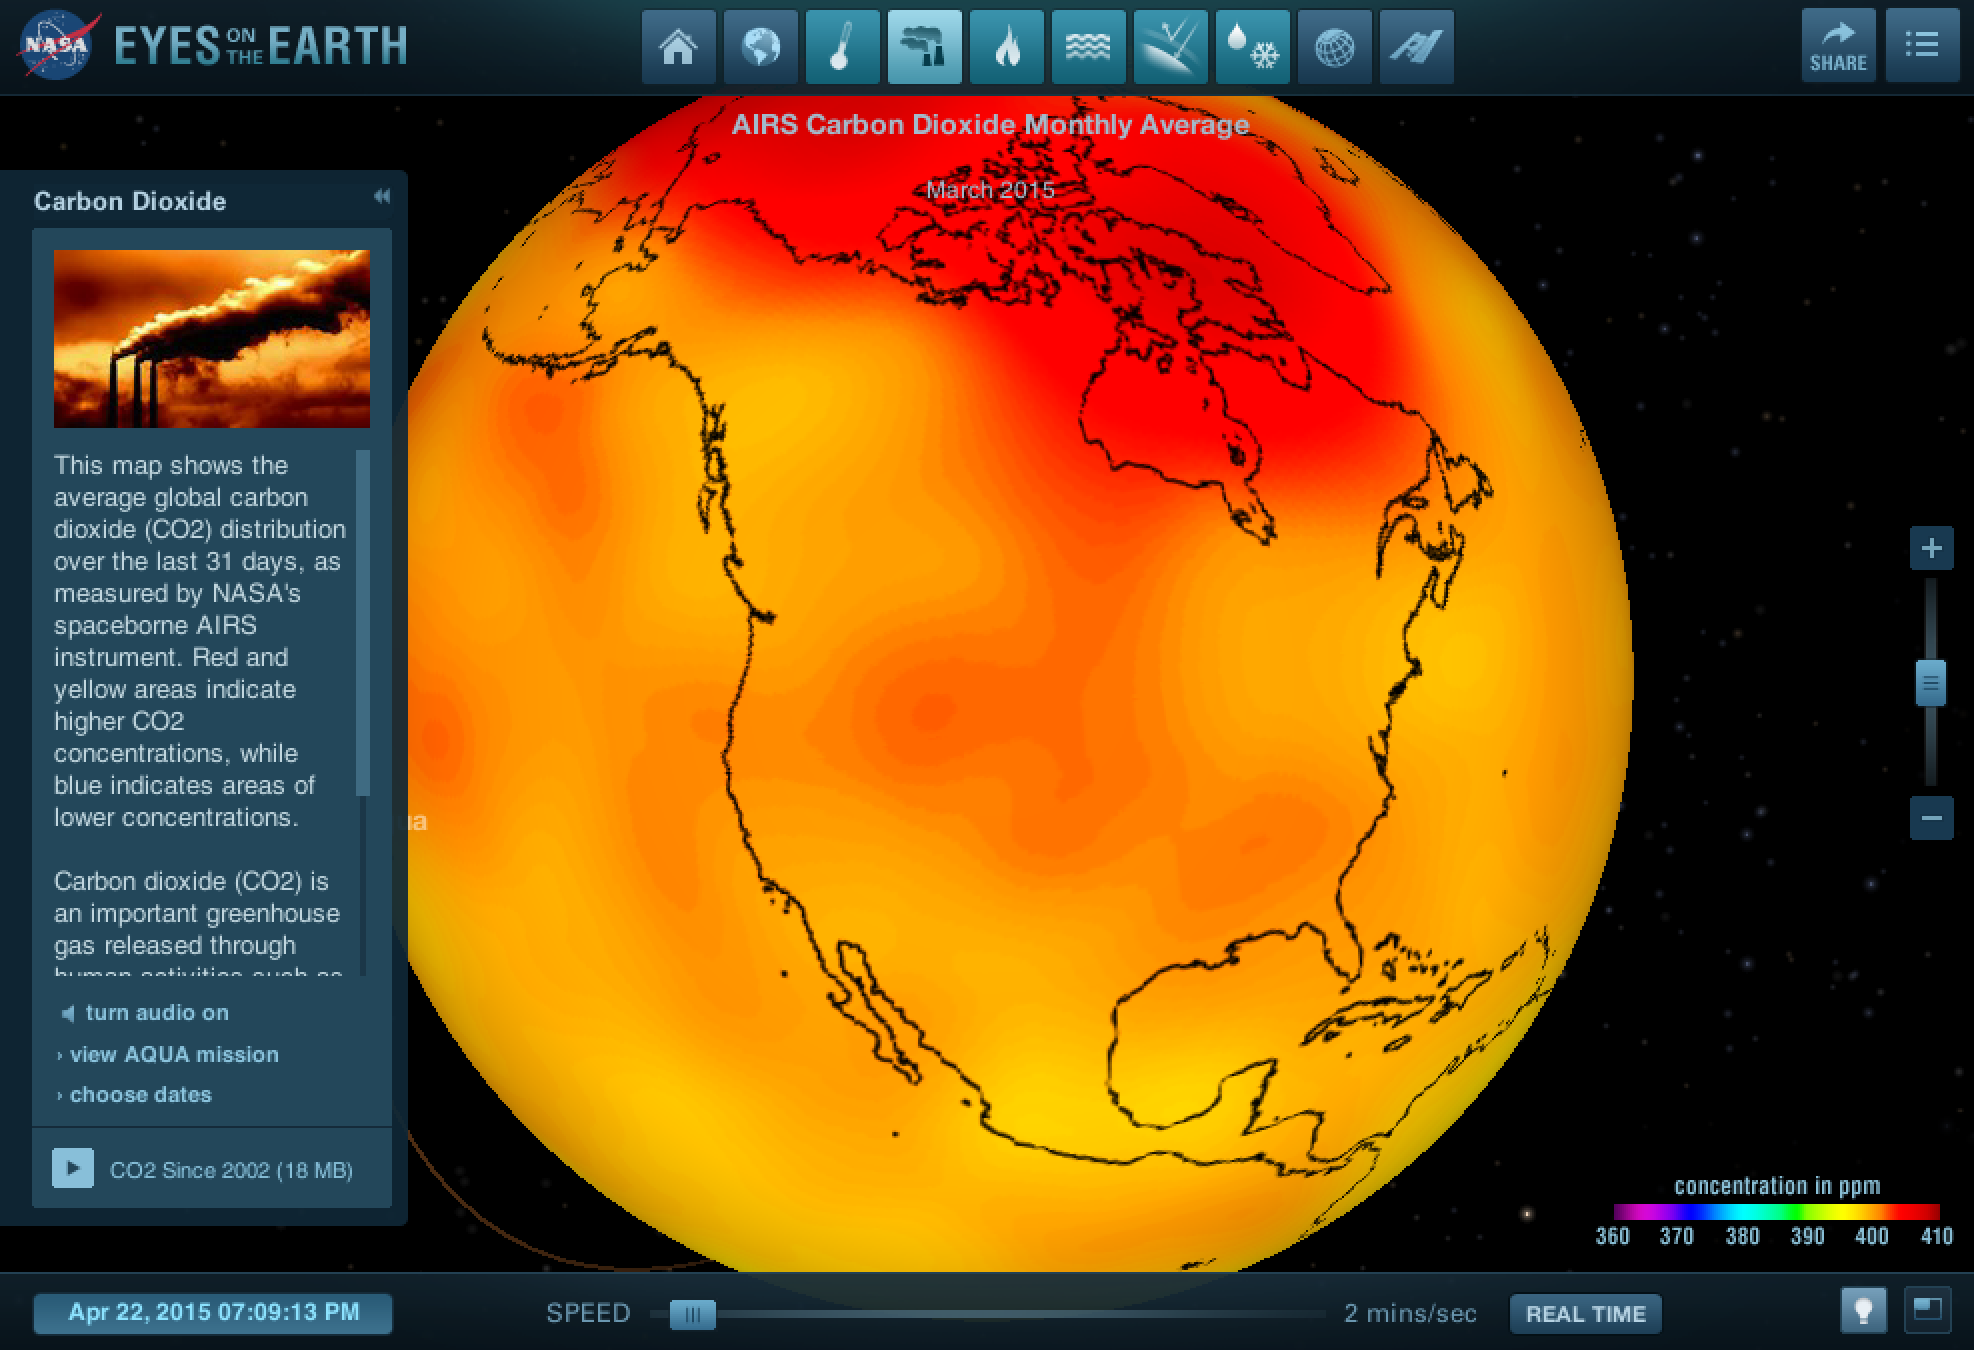
Finally, “Eyes on Earth” is a program where you can see the world under different perspectives. There are heat maps of carbon dioxide, sea level, amount of ice. This tools allows you to see the parts of the world most affected by climate change, the countries with most pollution, etc.
I loved the website! I think the do a really good job at presenting with images the current state of the world. The website presents shocking facts, that make you want to start the change! Everyone should definitely check it out!
Maria
Hi Maria,
I really enjoyed working my way through this website. I especially enjoyed the “Eyes on Earth” section that you spoke about in your post. Typically, I am a very visual person when it comes to learning and understanding new material and it was very nice to see these images of the earth under different scenarios. This section was also especially helpful in understanding the different scalar level of climate change. Looking at each image you can see the larger global picture, but it allows you to identify different smaller regions where climate change is having especially harsh effects.
This website is super cool! The way it presents its information makes it easy for the viewer to understand, but at the same time makes it interesting. The information presented on the homepage is informative yet brief, making their point easy to understand without that much effort. By doing that, they have grabbed the viewer’s attention and force them to dive deeper into their material by clicking on one of the tabs.
I think the most effective piece of evidence they presented was the tab “Images of Change.” In this tab, like you said, the website compares photos of places that have been impacted by climate change. Having a photo of a lake 30 years ago looking healthy next to a photo of that same lake now almost non-existent is frightening.