Exploring the Ocean Floor with Nautilus Live

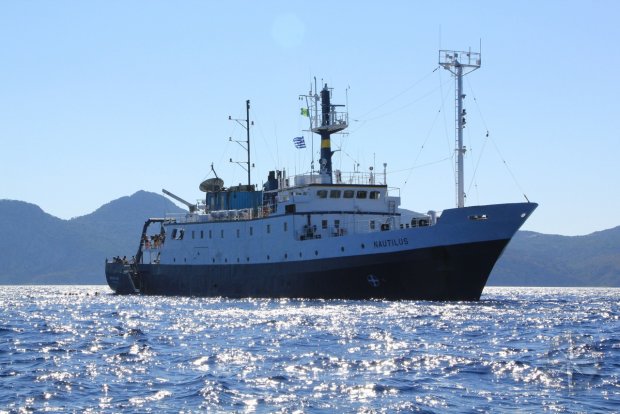
In our modern world of of GPS, when it seems like there is no frontier left, the ocean floor remains largely unexplored and unmapped. This website, hosted by National Geographic, follows the crew and scientists aboard the Nautilus. The crewmembers’ most recent mission was from June to November 2013 to explore the Gulf of Mexico and the Caribbean, mapping geological, biological, archaeological and chemical aspects of these areas to depths of about 2000 meters. Highlights of the trip included new discoveries of shipwrecks.

The beauty of this website is that it allows the general public- elementary school students, college professors and scientists, and average curious people- to connect with the crew. The website includes pictures from the missions, including this one of the bow of a shipwreck.

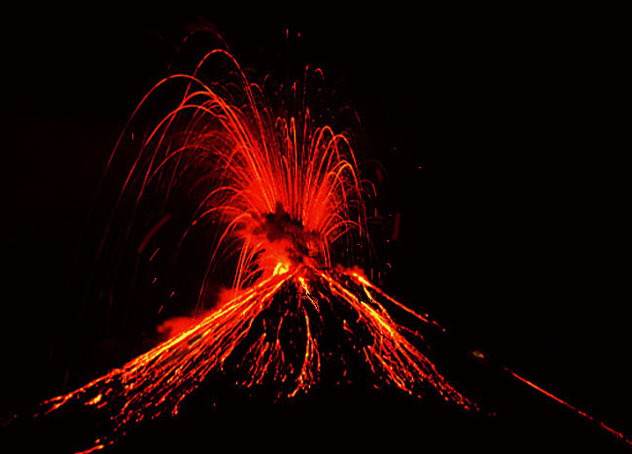
Additionally, the site provides videos of the ship’s robots, Hercules and Argus, at work, collecting samples thousands of feet below the surface. This is an image of Hercules using a temperature probe to test an underwater volcano:

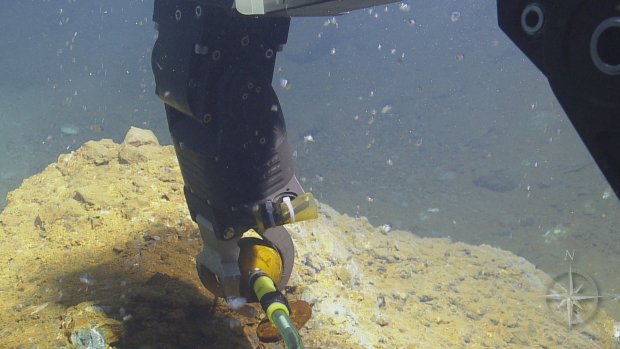
The most interesting part of this website is that during missions, it connects directly to the crew aboard the ship. It shows a live video feed of the ship’s activities and allows students and the public to chat live with the Nautilus’s educators, who respond on an audio feed to students’ typed questions.

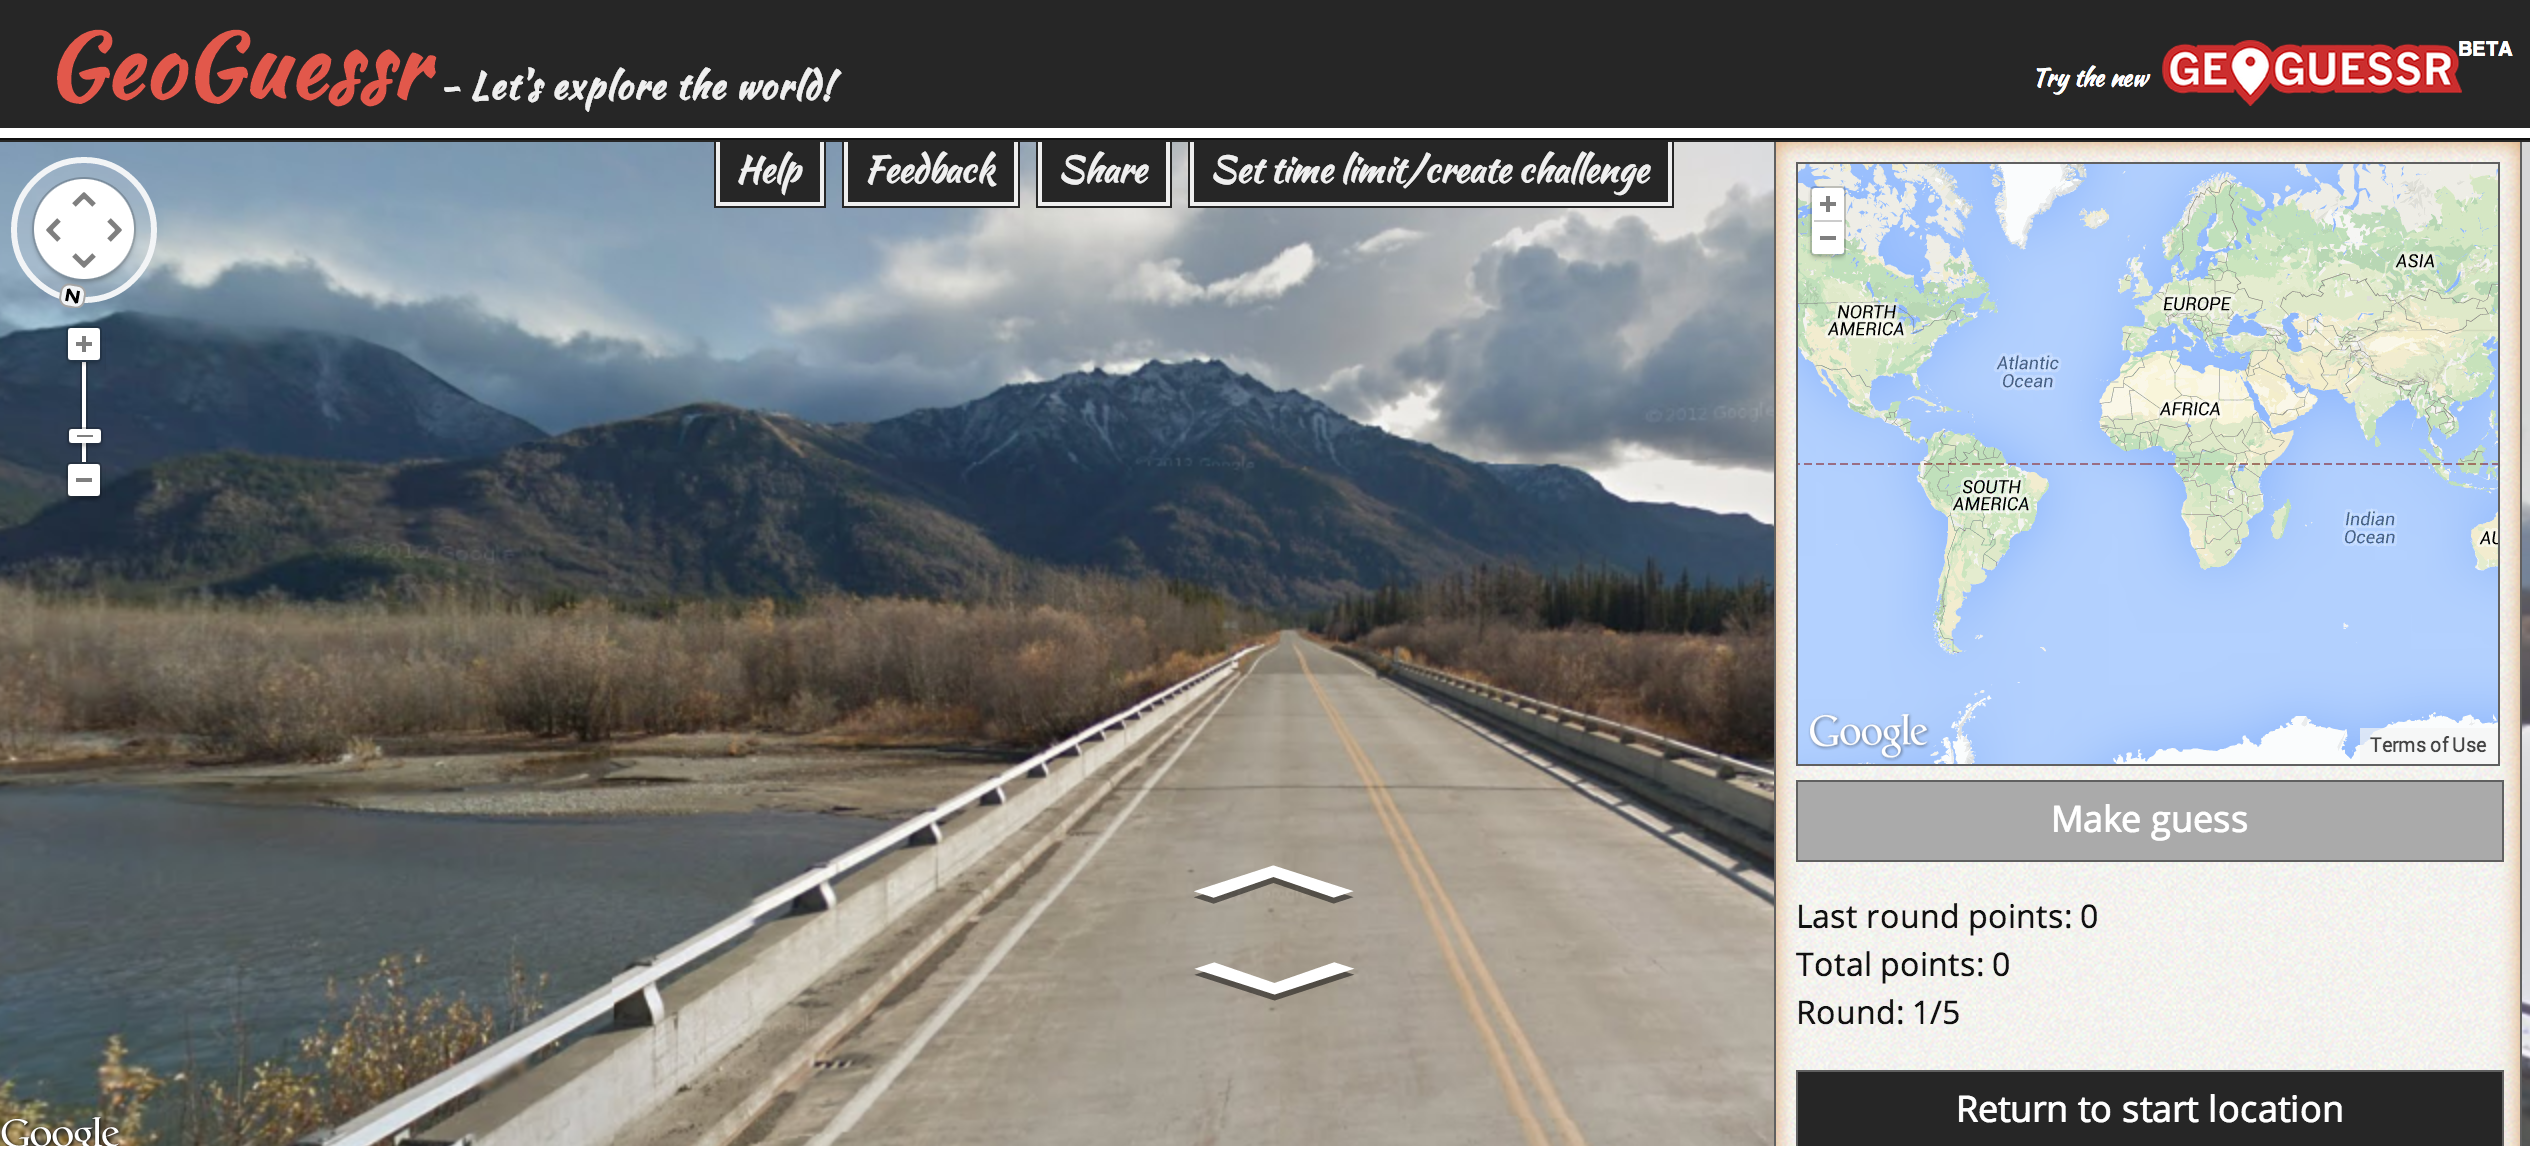
Finally, the site includes helpful links for teachers and kids, including interactive mapping and robotic design games to encourage and inspire future geographers to explore the ocean frontier.

http://www.nautiluslive.org/

GeoGuesser – Let’s Explore The World!

Use your knowledge of the lithosphere, pedosphere, and biosphere to guess where in the world these google map locations are!

Think you’re a geography expert? Test your knowledge with BBC Travel’s Geoguessr – the game that proves how well you know the world! As we explore the Lithosphere and Pedosphere and Biosphere check your skills against your knowledge. First, move around using your mouse and figure out where you are. Do you see some rich, red soil? What about volcanoes, palm trees, deserts, or oceans? Using your physical geography knowledge, try and guess where in the world you are located.Then click on the map in the lower right hand corner to place your marker (zoom in to increase your accuracy). When you’re sure, click the “make a guess” button, and find out how close you were!

Over 5 million miles of roads in street view by June 2012.

Unfortunately, because the site relies upon google maps, all locations will be along roadways limiting the world to just the 5 million miles of roads with street view images in over 39 countries.  Once you’ve mastered the basics, challenge my most recent score by clicking on this link. The world’s a huge place – get exploring and post your highest scores in the comments below!

Find out how close you were to each guess!

The Ten Most Spectacular Geologic Sites

After learning about the pedosphere/lithosphere in class. I was extremely interested in the rock cycle and how various rocks were created. After the last exam, I know you all are familiar with the three main types of rocks and how they can form from one another. After studying, I wanted to do a little bit more research on interested geologic features on the Earth’s surface. I came across this website, which I found to be extremely fascinating! You all should check out these pictures.

See if you can recognize a few of these geologic sites that we mentioned in class!

Enjoy


http://www.smithsonianmag.com/science-nature/The-Ten-Most-Spectacular-Geologic-Sites.html?c=y&page=1

Forces of Nature

On the National Geographic website, I found an interactive and informative activity called Forces of Nature. Not only can you read up on tornadoes, volcanoes, hurricanes, and earthquakes, watch videos, view pictures, and learn about different case studies, but you can also improve your knowledge by causing a tornado, building a volcano, spinning off a hurricane, and setting off an earthquake. For example, to trigger an earthquake, you choose the ground type (bedrock, landfill, fault zone) that the building stands on, and the magnitude (low, high) of the earthquake, set it off, and see how the building responds to the earthquake. If a high magnitude earthquake occurs on a fault zone, for example, there will be significant displacement—sometimes the building may collapse partially or entirely. This earthquake activity in particular reminded me of our discussion in class about the Mercalli Scale that measures the damage the earthquake does. Check out all the Forces of Nature and play around with the conditions to create either a moderate or deadly disturbance.

http://environment.nationalgeographic.com/environment/natural-disasters/forces-of-nature/

Pangea Ultima

In a world that has evolved since the supercontinent Pangea, we may be heading for another supercontinent called Pangea Ultima. Plate tectonics have created the spatial arrangement of our continents and will continue to do so over millions of years. This may be hard to believe, but the temporal scale for this movement is so large that we will not see any change in our lifetimes. It is amazing to think that we were all one continent, now separate and with our own separate cultures. What will it be like when Earth has only one continent again? Will there even be people living on Earth 250 million years from now? Learn more!

http://science.nasa.gov/science-news/science-at-nasa/2000/ast06oct_1/ 

Check Out the Most Recent Earthquakes in the United States!

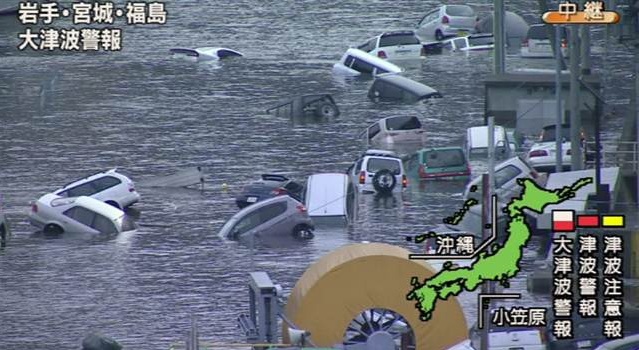
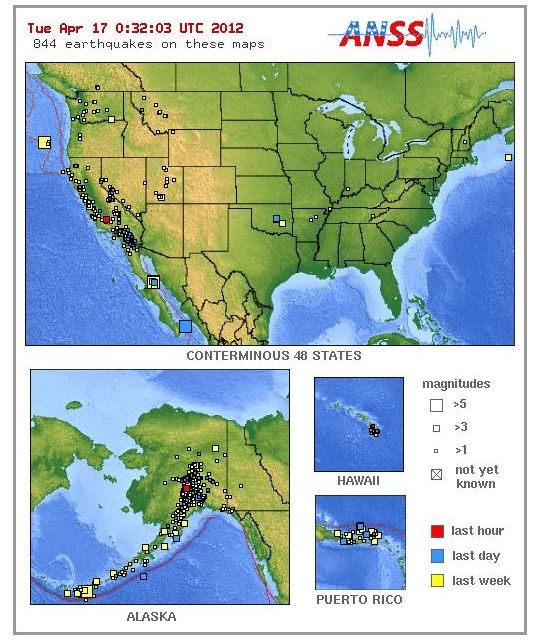
We have spent a lot of time throughout this course discussing earthquakes as they are an important consequence of the phenomenon of plate tectonics in the lithosphere and cause long lasting effects on the biosphere when they occur. In class we often focused on the largest, most local, and most significant earthquakes. The earthquake in the Philippines, the tsunamai caused by the earthquake in Japan, and the termor felt in our backyard in Mineral, VA are all events that are well documented and widely known about. However, during one of our lectures, we were presented with a slide that revealed the estimated probability of an earthquake occuring in any given region across the United States. Of course, western California and the Aleutian Islands in Alaska were the most areas of the highest expected earthquake activity. Still, there was a spot in central Virginia which was higher in probability than surrounding regions.

As I recalled that map I wondered how often do earthquakes actually occur? Are the earthquakes that we feel ourselves, and that make the news more or less the majority of earthquakes that actually occur, or do I have absolutely no idea how often the Earth is flexing it’s tectonic muscles? Luckily, I stumbled upon the site linked below which I found to be truly astonishing. The website (compliments of USGS) displays up-to-date earthquake occurrences across the United States and symbolizes them by intensity as well as how long ago they occurred. I was shocked to see that when I last checked, in the previous hour there had been seven earthquakes in the US including Alaska and Hawaii.

http://earthquake.usgs.gov/earthquakes/recenteqsus/


Just click the “Refresh” button to view the most recent earthquakes in the US!

Furthermore, you can follow the link below which focuses on the southeast United States where you can see it looks like there have been four or five earthquakes in Virginia in the past six months, but when you zoom in it displays that there have actually been close to 20 in the past six months! Something, I was definitely not aware of.

http://folkworm.ceri.memphis.edu/recenteqs/

These maps reinforced in my mind the idea that battle between tectonic plates is a constant war being waged, and that the times when we can actually feel the ground trembling ourselves are just grand moments in the eternal push-and-pull of the earth’s tectonic plates, and that perhaps one of the most revelant ways that science can save human lives is through furthering our knowledge of these natural forces.

Conor, out

Earth’s Surface: Peaks to Depths

I found this neat diagram below titled “tallest mountain to deepest ocean trench” on Our Amazing Planet.

Some of the connections I’ve made to our study of physical geography include the relationship between altitude and air pressure, the formation of different types of clouds, levels of oxygen, orogeny, and the formation of islands.

For example, the air pressure right around the peaks of the Himalayas is .33 atm which is a third of that measured at sea level, exemplifying the inverse relationship between altitude and air pressure that we have learned about.

The infographic provides points along altitude that indicate how long it takes to boil an egg, which relates to our study of water- a liquid boils at the temperature when its vapor pressure equals the surrounding pressure, thus explaining why it takes longer to boil at higher altitudes.

I enjoyed Googling different peaks that  I was not familiar with such as Puncak Jaya in Papua, Indonesia which is the world’s highest island peak. When looking into this island I found that it was created in the late Miocene Melanesian orogeny, caused by oblique collision between the Australian and Pacific plates.

See the animated map of the extent of the glaciers of the Carstens Range (including Puncak Jaya) from 1850 to 2003 which depict a significant retreat of glaciers in this equatorial geographic location. It was interesting to connect this to our study of temperature and seasonality around the equator.

One of the reasons this image caught my eye was it’s information on oceanic life and geography below sea level, which I am extremely interested in and is one of the reasons I chose to study abroad in Australia.

It is just amazing to see in terms of depth how far down the oil riser goes for an oil rig in comparison to the depth records of scuba divers.

The diagram illustrates the increased pressure below water and depicts how far humans have gone within an atmospheric diving suit as well as the deepest nuclear submarine achieved by the Soviets. I was surprised how much further down the Titanic was found.

The diagram allows for a great comparison of depth with other iconic locations such as how deep the grand canyon is below sea level, that sharks are found within 7,000 feet from sea level prior to the “midnight zone” of no sunlight, and that the average ocean floor depth is 12,000, however the oceanic trenches that we’ve studied are beyond 20,000 feet below sea level.

Volcanoes

After talking about volcanoes in class I became interested in learning more about them. I came across an interactive website that explains how volcanoes form and how humans react to them. The site features different sections about volcanoes each featuring their own video clips.

The mantle is a large layer of rock that is mostly solid. Rock from the mantle will melt and is able to move to the Earth’s surface through weak spots in the crust in a volcanic eruption. Most volcanoes occur on plate boundaries or over a hot spot. Colliding plates or convergent plates tend to create large, classic, cone-shaped volcanoes called stratovolcanoes. These volcanoes also tend to be particularly explosive. At separating plates or divergent plates, shield volcanoes tend to be formed. Shield volcanoes have gently sloping sides and the lava flow tends to be calm and smooth. Hotspots also cause shield volcanoes to form.

Volcanic eruptions cause many different types of hazards. In an explosive eruption, pent-up gases escape violently and magma bursts from the volcano. The cooled magma can cover large areas with a thick layer of ash, which is very detrimental. Pyroclastic flows are a mixture of hot gas and cooled magma. These flows are very dangerous as the flows move at very high speeds, so the destruction is spread over large areas quickly. Volcanic eruptions can also cause earthquakes, tsunamis, or the release of suffocating gases. All of these hazards pose threats to human life, property, and the environment.

Scientists are becoming more and more accurate in detecting the warning signs of volcanoes. Many different types of tools, such as the correlation spectrometer, have been developed to aid scientists in their predictions. Although volcanologists are becoming very skilled at predicting the likelihood of an eruption many different barriers remain. Monitoring potential eruptions is expensive. There are many volcanoes in the world that only erupt every hundred or thousand of years. Thus, scientists are not able to fully monitor every site. However, for the most part with monitoring devices people will be warned well before a disastrous volcanic eruption occurs.

http://www.dosomething.org/files/pictures/Volcano.jpg

http://www.dosomething.org/files/pictures/Volcano.jpg


Source: http://www.learner.org/interactives/volcanoes/entry.html


Japan’s Triple-Threat Crisis Interactive Map

After attending the inter-disciplinary presentation on Japan after one year of the triply devastating earthquake, tsunami and nuclear power events, I wanted to do more research on the events of the day March 11, 2011. The chain of events were extremely well documented, and can be found on many websites and blogs, such as the Huffington Post. I found an interactive map from CNN that shows the countrywide impact of the tsunami, earthquake and nuclear power plant failures.

Map of Japan after 2011 Earthquake

The interactive map allows the user to manipulate settings between broad categories of events on March 11, as well as casualties and damages caused. One can see that the epicenter of the 9.0 earthquake was located extremely close to the northeastern coast of Japan, in addition to the recorded 13 aftershock earthquakes that were measured to posses almost as much energy as the original 9.0 earthquake. The most casualties (over 19,000 total) were along the northeastern coast of Japan, but casualties were observed throughout the country. The worst damage was found along the entire northern land of Japan. After the events of March 11, 2011, Japan lost over $44 billion in infrastructure.

Cars Floating in Japan after Tsunami

The nuclear power plant near Minamisoma video shows utter destruction of the city, where panic grew even more after discovering the possibility of  nuclear power plant failure. Many people were displaced due to the earthquake, tsunami, and radioactive zone around the 54 nuclear power plants in Japan. Currently, there are two power plants that are being used for Japanese power and electricity, but by this summer there will be no usable nuclear power plants in Japan. This creates a large economic and political problem for Japan, where there is an apparent shortage of power and electricity in a highly industrialized country. Adding to the problem, Japan is not a naturally resource-rich country: it must import the fossil fuels to make up for the loss of nuclear power (what used to be 30% of the country’s power generation). It is probable that Japan will resort to importing  high amounts of fossil fuels (such as coal, oil and natural gas) as power to stabilize the country in the near future.

Japan is on its way to recovery and reconstruction after a devastatingly large earthquake, tsunami and threat of nuclear power plant meltdown, and it will be interesting to watch what Japan must do to remain a large worldpower.

Website: http://www.cnn.com/SPECIALS/2011/japan.quake/map/

Global Volcanism Project

http://www.volcano.si.edu/index.cfm

Call it the inner child, but I have always had a fascination with things that go “BOOM!” Of course, when we began to learn about volcanoes in class, my ears perked up and I looked forward to finding out about their development and the predictability of their eruptions.

This site, sponsored by the Smithsonian creates a world-wide map of all the volcanoes, but above water and under water and gives significant information about their most recent explosions, their size, their history, etc. They even have interactive maps in which you can click on any volcano in the world and find out just about everything known up to date.

It was also interesting to find out that most volcanoes don’t have the resources and funding available to predict the future eruptions and monitor the seismic activity. It takes a lot of money and apparently we don’t have enough funding to keep track of every volcano. Clearly this means there is a lot of danger for anyone around an unmonitored volcano at any time.

The site provides information on literally everything you might need to know about volcanoes but it also admits the things we do not know about volcanoes and unpredictability that is associated with them. This is a great resource for anyone interested in volcanic activity across the world as it is constantly updated with new peer-reviewed articles about eruptions and predictions. I would suggest this to any curious GIS-er or civilian scientist looking for volcanic information..


-Patrick Jones