Gorillas and Vegetation in Africa’s Oldest National Park

Analyzing the Distribution of Vegetation Zones and Mountain Gorillas in Virunga National Park

Mountain Gorilla

How are abiotic factors, vegetation zones, human activity, and distribution of mountain gorillas linked?

On National Geographic’s Website (https://www.nationalgeographic.org/activity/analyzing-distribution-vegetation-zones-and-mountain-gorillas-virunga-national-park/), there is an interactive activity in which scientists and geographers analyze Virunga National Park along the eastern edge of the Democratic Republic of the Congo along the Mitumbar Mountains. It is the oldest national park in Africa. The geography of this park ranges from grasslands and wetlands, to lava plains and natural glaciers, and is home to various species (nat.geo.org/mapmaker-abiotic-factors-virunga). 

The national park was designated in order to protect these mountain gorillas. They are omnivores but usually have plant-based diets. “Poaching, encroaching human populations, and violent conflicts in the area continue to affect mountain gorilla populations” (https://www.nationalgeographic.org/activity/analyzing-distribution-vegetation-zones-and-mountain-gorillas-virunga-national-park/ ). Illegal timber cutting is also becoming a big issue in the area. This is mappable from the site.

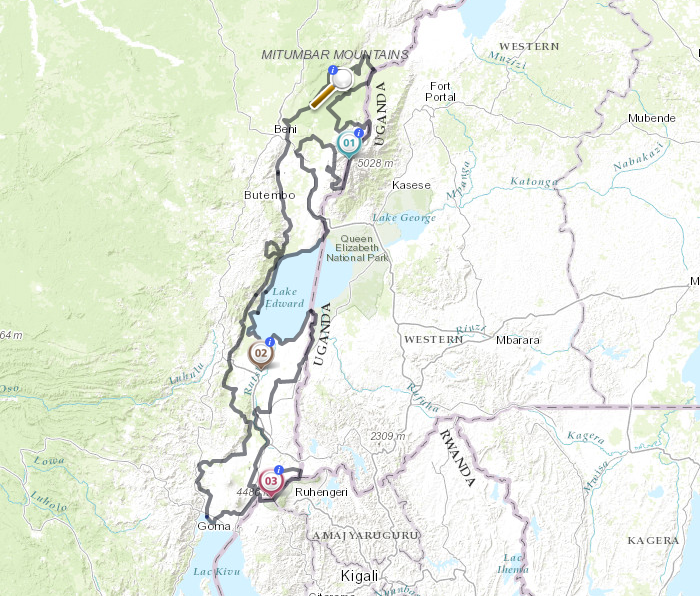
This Website shows the change in vegetation and gorilla populations in the National Park as a result of human activity. This relates to physical geography because it connects the lithosphere and biosphere between the national park territory and anthropocentric effects.

With a rise in populations it is more imperative now that people are made aware of the changes this ecosystem is experiencing due to selfish and illegal activity on supposedly-protected lands.

Website; https://www.nationalgeographic.org/activity/analyzing-distribution-vegetation-zones-and-mountain-gorillas-virunga-national-park/


Tracking Lightning

LightningMaps.org is a map that shows lightning strokes around the globe in real time. The site gathers data from radio frequency signals that collect information on where lightning strokes occur. This is a community driven website so the information is crowdsourced and does not come from one specific governmental agency. Operators at radio frequency stations submit their information and the website then creates digital markers at the locations where lightning is being recorded. Due to a large network of operators sending information, the accuracy of the strokes is about one mile. This system covers specific areas in Europe, America, and Oceania. The website also stores strokes for up to 24 hours.

This website is especially interesting because amateur weather scientists can get involved recording lightning and adding to a global database. Also, this website acts as a good supplement to people who are looking to follow storms in real time. The website is easy to use with just a few buttons and four different overlays.

https://www.lightningmaps.org/blitzortung/europe/index.php?lang=en

National Geographic Encyclopedic Entries

The National Geographic encyclopedic entries page is a really useful tool for our Physical geography class since it provides various entries on class related concepts like hot spots, El Nino, earth’s crusts, continental drift, etc. It’s really easy to use, you can either enter the topic you are interested in looking for or just scroll down the pages looking for it. Each entry provides a set of images, definitions, animations, videos, background information, related material and even useful sources that connect to other articles about the subject.  There’s even a complete vocabulary tap that expands on explaining each key term’s definition and use. This would be a really useful tool to study for our final exam since you can search in a more interactive way concepts that you feel you need to look up more information about.

https://www.nationalgeographic.org/encyclopedia/

Climate Initiatives Program

The UN Environment and Dutch Ministry of Infrastructure and the Environment-partnered Climate Initiatives Program (CIP) is a platform dedicated to sharing information on current initiatives combating climate change across the world. The number of initiatives is currently 224 and counting. Initiatives are grouped under Themes that range from Finance to Waste to Energy. You can search for specific terms or events or simply browse the data base and sort by Theme. Creating an account helps you stay up to date on all the latest developments in the climate change topics you are passionate about. You can keep initiatives up to date without having to request approval from the administrators.

Perhaps the most interesting parts of this website are its Success Stories and Impacts sections. The former gives the impression that this is not a losing battle and that contributions to this cause do have real, positive effects on the environments around us. You can even opt to create your own success story if you have been active in a certain project in your community. The impacts of international climate initiatives (ICIs) section also offers external information and sources that offer more information on pending and current initiatives covering cities and regions throughout the world.

USGS Natural Hazards

The United States Geological Survey (USGS) has a section on Natural Hazards in which it discusses how every year, natural hazards threaten lives and result in billions of dollars in damage. The USGS work with many partners to monitor, assess, and conduct targeted research on a wide range of natural hazards so that policymakers and the public have the understanding and all of the knowledge they need to enable preparedness, response, and resilience.Through the Natural Hazard programs, the USGS provides alerts and warnings of geologic hazards and supports the warning responsibilities of the National Oceanic and Atmospheric Administration (NOAA) for geomagnetic storms, tsunamis, and volcanic ash.

One part of the Natural Hazards section is the Global Seismographic Network (GSN). The GSN is a permanent digital network of seismological and geophysical sensors connected by a telecommunications network. It provides, worldwide monitoring of the Earth, with over 150 modern seismic stations distributed globally. With real-time information about the status of the GSN stations and real-time recordings, we are able to know where there is seismographic activity all over the world.

Link: https://www.usgs.gov/science/mission-areas/natural-hazards?qt-mission_areas_l2_landing_page_ta=0#qt-mission_areas_l2_landing_page_ta

Storm Prediction Center

The National Oceanic and Atmospheric Administration’s (NOAA) National Weather Service’s (NWS) Storm Prediction Center contains numerous maps of the United States that show if any severe weather is present or if there will be any in the future.  Their “Forecast Products” include Current Convective Watches and Outlooks, which show the potential for tornadoes and severe thunderstorms from today to eight days away; Current Mesoscale Discussions, which show all current severe weather; Fire Weather Outlooks, which show the potential for wildfires today and up to eight days away; and the Watch, Warning, and Advisory Display (WWA) which shows all types of WWAs.  All of these maps are easy to understand and allow the user to easily see which type of hazardous weather is in their area.  The user can also read a detailed statement released by the NWS that explains what could happen.

It is pretty impressive that the NWS can predict severe weather up to eight days in advance.  People can use this site to see if any storms are heading their way and how bad they will be.  However, the thing about weather is that it is always changing and the NWS constantly needs to update their maps and descriptions.

NWS Watch, Warning Advisory Display 12/02/17 1:16pm EST


The Restoration of Sequoia National Park’s Giant Forest

There’s a section https://www.nps.gov/seki/learn/historyculture/gfmain.htm on the National Park Service’s website that discusses the restoration of Sequoia National Park’s “Giant Forest,” which contains one of the largest groves of the “[a]we-inspiring” sequoia trees that are found only on moist areas along the western slope of the Sierra Nevada mountain range. This site gives a brief overview of “giants'” decision to commence the Giant Forest restoration project and of the goals of the project, then gives, at the end of the page, links to pages with before-and-after photos, descriptions of visitors’ experiences, information regarding the impact of human development on the area, and information regarding the natural ecosystem of the Great Forest and the successful restoration of the area’s soil and vegetation. I thought the before-and-after photos were particularly interesting because they illustrated just how much has changed since the commencement of the project in the late 1990s. The site said that since the project began, 231 acres of land have been restored and 282 buildings have been demolished (and the few visitor facilities that remain have been converted into buildings that can only be accessed/used during the daytime), but a picture is worth a thousand words. The before-and-after pictures illustrate just how much natural beauty human encroachment/development/influence robbed the forest of.

While the Giant Forest was saved from the devastating effects of logging when it was designated part of Sequoia National Park, the effects of human encroachment were still seen in the changed drainage patterns, the clearing of trees, and the depletion of topsoil organic matter. The Giant Forest was in desperate need of restoration, and thankfully, the restoration project started in the late 1990s was a resounding success in that it both achieved its original goal — to restore the natural landscape — and it demonstrated just how large an impact a group of dedicated conservationists can have.

The Office of Federal Sustainability

The Office of Federal Sustainability website is a great resource to learn about the energy use of the US government, which is the largest energy consumer in the country. The Office of Federal Sustainability is a sub-department of The Council on Environmental Quality, an executive office of the White House which advises the President on environmental issues and policy.

The site explains the initiatives undertaken by the government to reduce energy use across its 360,000 buildings and 660,000 vehicles. Graphs and charts showing the energy usage of various government agencies are available. There is also a ranking of all federal departments in terms of energy use and sustainability initiatives. The scorecards rate each agency on a green, yellow, red scale in terms of whether or not the agency is compliant with environmental goals in areas such as water use reduction, renewable energy usage, green building development, and emissions reduction. Another section of the site is dedicated to policies, executive orders, and statutes concerning environmental issues. Furthermore, the website provides an array of other resources about energy conservation in the federal government and beyond. It is helpful to understand the US government’s policies regarding the energy use of its own agencies since the federal government serves as an example of sustainability to both citizens and corporations.

Link: https://www.sustainability.gov/index.html


USGS and Fire Science


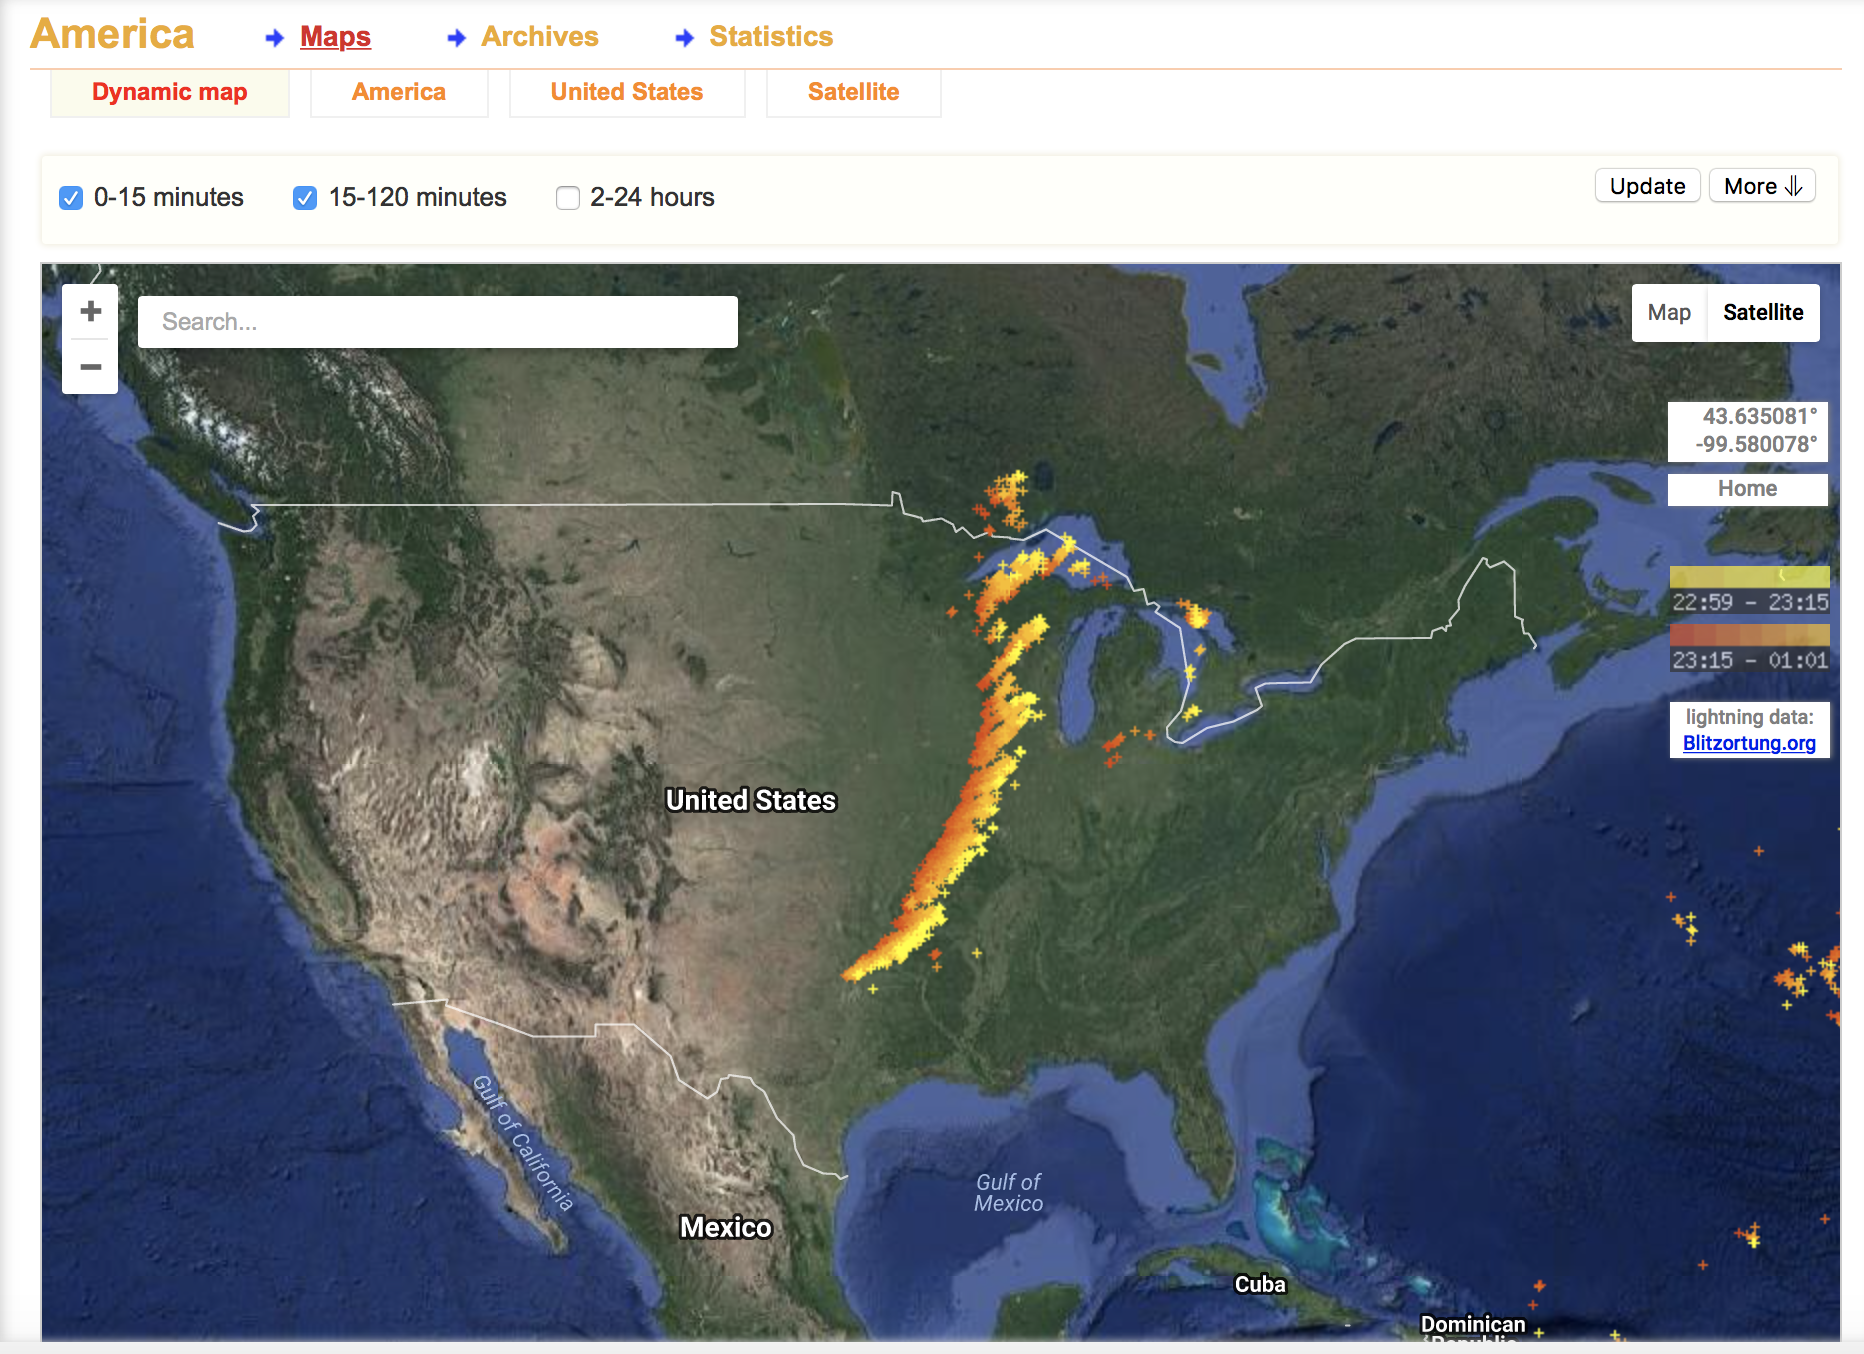
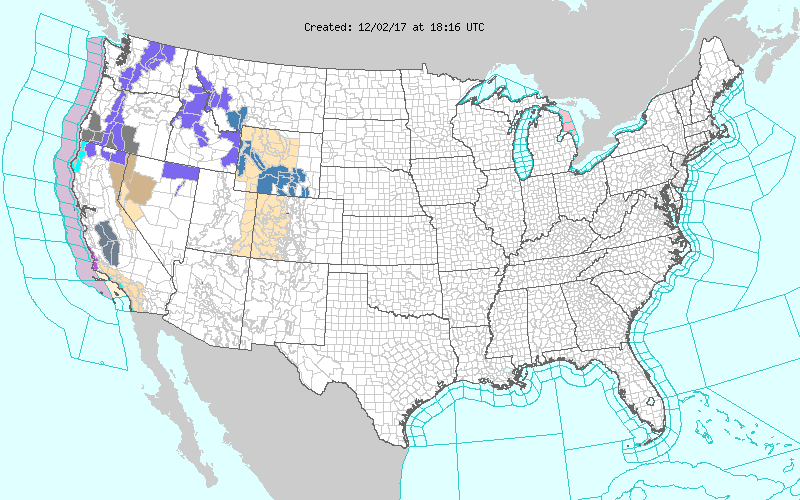
The United States Geological Survey (USGS) is an agency of the government that studies the landscape, natural resources, and natural hazards of the US. These categories include information about the water, energy, minerals and natural resources in the US, as well as the health of our environment and the impacts of climate change and land-use change.

With the recent wildfires in California, the USGS is more important than ever. Its technology helps produce science, data, and tools that are critical in making decisions before, after, and during wildfires. On their Wildland Fire Science webpage, the USGS goes into the specifics of their fire research, data, and tools.

In the Fire Science section of this website, the USGS goes into greater detail about large fire forecasts, fuel mapping, and burn mapping. In the large fire forecasting portion, there is a map that uses satellite imagery to show daily fire potential predictions. In the fuel mapping portion, there is a map with over 20 geospatial layers that describes vegetation, disturbance, fuel, and fire arrangements for the United States. Finally, the burn mapping portion describes projects designed for mapping the perimeters and severity of wildfires in the US. Overall, the USGS provides advanced and useful tools for the government and individuals to look at in-depth data about forest fires.

https://www2.usgs.gov/ecosystems/environments/fireecology.html


Smithsonian Ocean Portal

This website, the Smithsonian Ocean Portal, is an educational website aimed to inform about the oceans. They offer a variety of resources and tabs, such as tabs on ocean life and ecosystems, planet ocean, the ocean through time, conservation, and human connections. Each tab also narrows to specific ocean species or categories, such as mammals or reptiles. The website stays up to date with blog posts and a newsroom that gives reviews of articles.

http://ocean.si.edu

One article talks about how the loss of ice in the Arctic effects species that rely on the ice to survive. One example of a species is a harp seal, which uses the ice for nursing and feeding its yearlings. Global warming and the melting of sea ice puts these seals and yearlings in danger of hypothermia, starvation, and crushed by moving ice in the Arctic. We often think about how global warming will effect us and the environments we live in, but its important to think about how it will effect other species and their genetic diversity.