and that means another total eclipse in North America.
For the last one, in 2017, I overlaid the path of totality on data showing the average cloud cover at the time of year of the eclipse. Here’s the same thing for the eclipse that’s coming on 8 April 2024: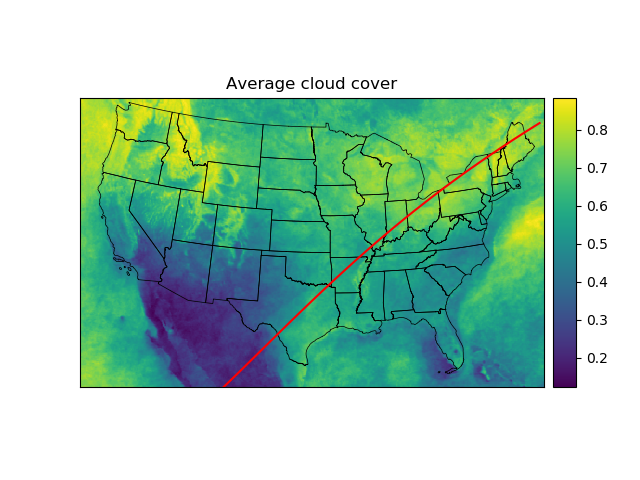
And here’s a graph of the cloud cover along the part of the path that lies within the US:
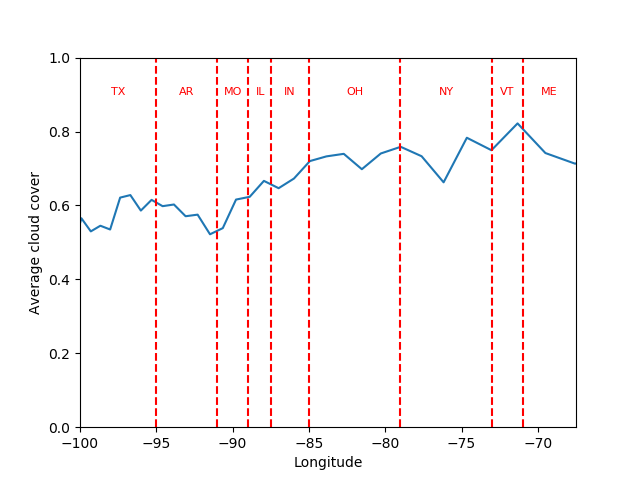
I used the same data sets and followed the same procedures as last time. (The only reason the styles of the pictures are different is that I switched programming languages in the intervening years.) The graph shows the states that the path of totality goes through, although as in 2017 I left off a couple of states (and provinces) that the path just barely touches.
Last time, the cloud data varied dramatically, which is why I went to Oregon to see the eclipse. This time, there’s much less variation, at least within the US. Mexico looks quite a bit better.
I haven’t figured out what I want to do yet. Last time, my brother was supposed to join me, but he couldn’t make it. I’ll see if I can get him this time.