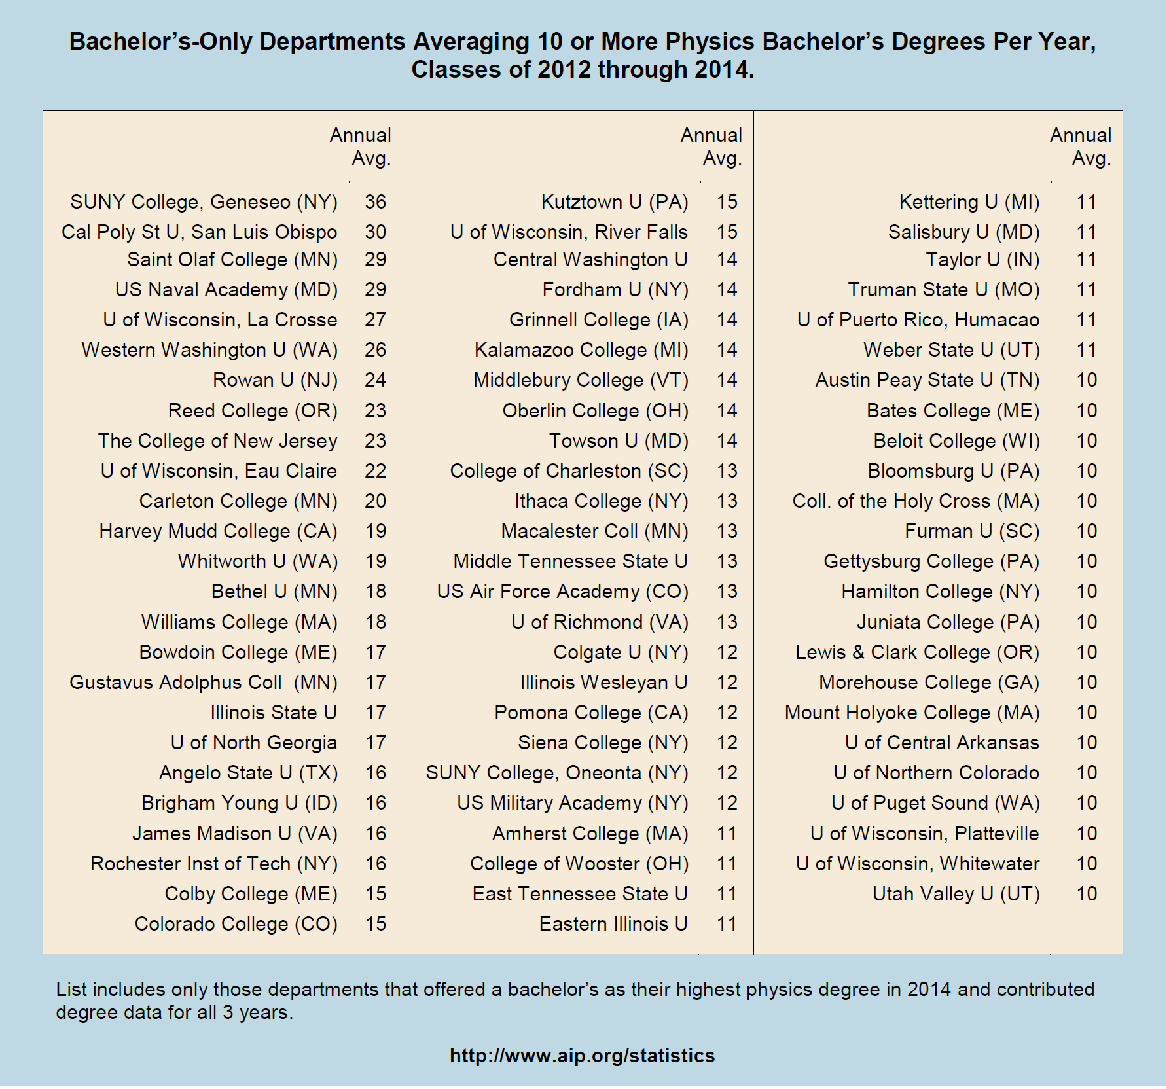
Oddly enough, I still read the Sunday New York Times on paper. As a result, I was extremely confused by George Johnson’s article headlined Gamblers, Scientists, and the Mysterious Hot Hand.
The heart of the article is this claim:
In a study that appeared this summer, Joshua B. Miller and Adam Sanjurjo suggest why the gambler’s fallacy remains so deeply ingrained. Take a fair coin — one as likely to land on heads as tails — and flip it four times. How often was heads followed by another head? In the sequence HHHT, for example, that happened two out of three times — a score of about 67 percent. For HHTH or HHTT, the score is 50 percent.
Altogether there are 16 different ways the coins can fall. I know it sounds crazy but when you average the scores together the answer is not 50-50, as most people would expect, but about 40-60 in favor of tails.
Maybe it’s just me, but I couldn’t make sense of this claim. The online version has a graphic that clears it up. The last sentence is literally correct (with the possible exception of the phrase “as most people would expect,” as I’ll explain), but I couldn’t manage to parse it. I wonder if it was just me.
Here’s my summary of exactly what is being said:
Suppose you flip a coin four times. Every time heads comes up, you look at the next flip and see if it’s heads or tails. (Of course, you can’t do this if heads comes up on the last flip, since there is no next flip.) You write down the fraction of the time that it came up heads. For instance, if the coin flips went HHTH, you’d write down 1/2, because the first H was followed by an H, but the second H was followed by a T.
You then repeat the procedure many times (each time using a sequence of four coin flips). You average together all the results you get. The average comes out less than 1/2.
I guess that might be a counterintuitive result. Maybe. Personally, I find the described procedure so baroque that I’m not sure I would have had any intuition at all as to what the result should be. Hence my skepticism about the “as most people would expect” phrase. I think that if you took a survey, you’d get something like this:
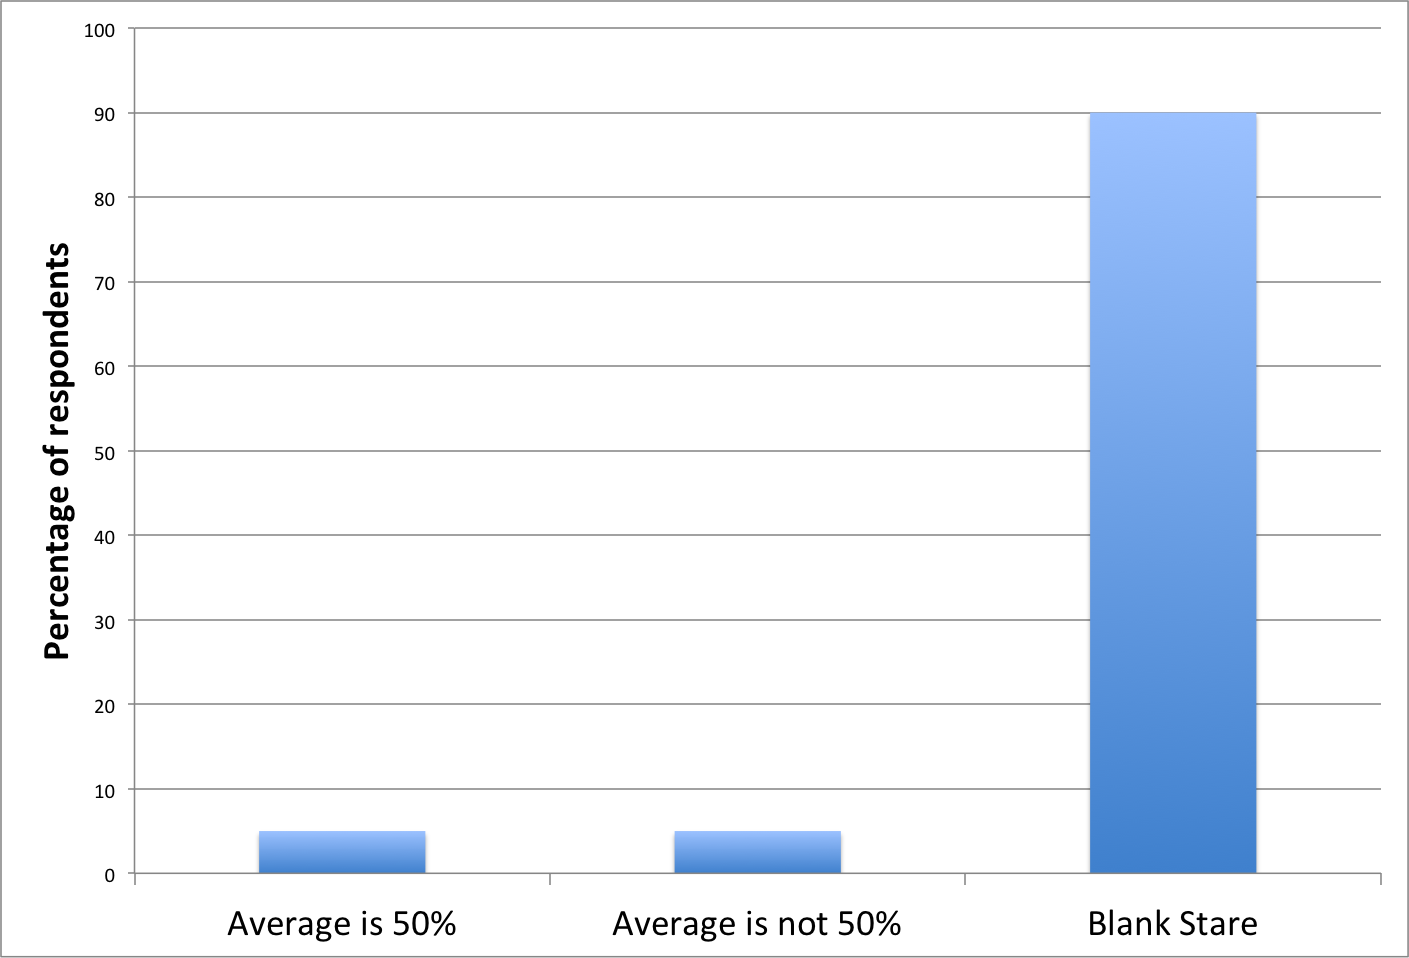
(And, by the way, I don’t mean this as an insulting remark about the average person’s mathematical skills: I think I would have been in the 90%.)
The reason you don’t get 50% from this procedure is that it weights the outcomes of individual flips unevenly. For instance whenever HHTH shows up, the HH gets an effective weight of 1/2 (because it’s averaged together with the HT). But in each instance of HHHH, each of the three HH’s gets an effective weight of 1/3 (because there are three of them in that sequence). The correct averaging procedure is to count all the individual instances of the things you’re looking for (HH’s); not to group them together, average those, and then average the averages.
My question is whether the average-of-averages procedure described in the article actually corresponds to anything that any actual human would do.
The paper Johnson cites (which, incidentally, is an non-peer-reviewed working paper) makes grandiose claims about this result. For one thing, it is supposed to explain the “gambler’s fallacy.” Also, supposedly some published analyses of the “hot hands” phenomenon in various sports are incorrect because the authors used an averaging method like this.
At some point, I’ll look at the publications that supposedly fall prey to this error, but I have to say that I find all this extremely dubious. It doesn’t seem at all likely to me that that bizarre averaging procedure corresponds to people’s intuitive notions of probability, nor does it seem likely that a statistician would use such a method in a published analysis.