The Restoration of Sequoia National Park’s Giant Forest

There’s a section https://www.nps.gov/seki/learn/historyculture/gfmain.htm on the National Park Service’s website that discusses the restoration of Sequoia National Park’s “Giant Forest,” which contains one of the largest groves of the “[a]we-inspiring” sequoia trees that are found only on moist areas along the western slope of the Sierra Nevada mountain range. This site gives a brief overview of “giants'” decision to commence the Giant Forest restoration project and of the goals of the project, then gives, at the end of the page, links to pages with before-and-after photos, descriptions of visitors’ experiences, information regarding the impact of human development on the area, and information regarding the natural ecosystem of the Great Forest and the successful restoration of the area’s soil and vegetation. I thought the before-and-after photos were particularly interesting because they illustrated just how much has changed since the commencement of the project in the late 1990s. The site said that since the project began, 231 acres of land have been restored and 282 buildings have been demolished (and the few visitor facilities that remain have been converted into buildings that can only be accessed/used during the daytime), but a picture is worth a thousand words. The before-and-after pictures illustrate just how much natural beauty human encroachment/development/influence robbed the forest of.

While the Giant Forest was saved from the devastating effects of logging when it was designated part of Sequoia National Park, the effects of human encroachment were still seen in the changed drainage patterns, the clearing of trees, and the depletion of topsoil organic matter. The Giant Forest was in desperate need of restoration, and thankfully, the restoration project started in the late 1990s was a resounding success in that it both achieved its original goal — to restore the natural landscape — and it demonstrated just how large an impact a group of dedicated conservationists can have.

The Office of Federal Sustainability

The Office of Federal Sustainability website is a great resource to learn about the energy use of the US government, which is the largest energy consumer in the country. The Office of Federal Sustainability is a sub-department of The Council on Environmental Quality, an executive office of the White House which advises the President on environmental issues and policy.

The site explains the initiatives undertaken by the government to reduce energy use across its 360,000 buildings and 660,000 vehicles. Graphs and charts showing the energy usage of various government agencies are available. There is also a ranking of all federal departments in terms of energy use and sustainability initiatives. The scorecards rate each agency on a green, yellow, red scale in terms of whether or not the agency is compliant with environmental goals in areas such as water use reduction, renewable energy usage, green building development, and emissions reduction. Another section of the site is dedicated to policies, executive orders, and statutes concerning environmental issues. Furthermore, the website provides an array of other resources about energy conservation in the federal government and beyond. It is helpful to understand the US government’s policies regarding the energy use of its own agencies since the federal government serves as an example of sustainability to both citizens and corporations.

Link: https://www.sustainability.gov/index.html


USGS and Fire Science


The United States Geological Survey (USGS) is an agency of the government that studies the landscape, natural resources, and natural hazards of the US. These categories include information about the water, energy, minerals and natural resources in the US, as well as the health of our environment and the impacts of climate change and land-use change.

With the recent wildfires in California, the USGS is more important than ever. Its technology helps produce science, data, and tools that are critical in making decisions before, after, and during wildfires. On their Wildland Fire Science webpage, the USGS goes into the specifics of their fire research, data, and tools.

In the Fire Science section of this website, the USGS goes into greater detail about large fire forecasts, fuel mapping, and burn mapping. In the large fire forecasting portion, there is a map that uses satellite imagery to show daily fire potential predictions. In the fuel mapping portion, there is a map with over 20 geospatial layers that describes vegetation, disturbance, fuel, and fire arrangements for the United States. Finally, the burn mapping portion describes projects designed for mapping the perimeters and severity of wildfires in the US. Overall, the USGS provides advanced and useful tools for the government and individuals to look at in-depth data about forest fires.

https://www2.usgs.gov/ecosystems/environments/fireecology.html


Smithsonian Ocean Portal

This website, the Smithsonian Ocean Portal, is an educational website aimed to inform about the oceans. They offer a variety of resources and tabs, such as tabs on ocean life and ecosystems, planet ocean, the ocean through time, conservation, and human connections. Each tab also narrows to specific ocean species or categories, such as mammals or reptiles. The website stays up to date with blog posts and a newsroom that gives reviews of articles.

http://ocean.si.edu

One article talks about how the loss of ice in the Arctic effects species that rely on the ice to survive. One example of a species is a harp seal, which uses the ice for nursing and feeding its yearlings. Global warming and the melting of sea ice puts these seals and yearlings in danger of hypothermia, starvation, and crushed by moving ice in the Arctic. We often think about how global warming will effect us and the environments we live in, but its important to think about how it will effect other species and their genetic diversity.

Oxbow Lakes

The website ThoughtCo. offers various articles on multiple subjects, including physical geography, political geography, urban geography, climate, etc.  Their goal is to provide resources for students and teachers of geography through articles, images, maps, etc. that explore these various topics within geography.  One article within the category of physical geography explains oxbow lakes.

https://www.thoughtco.com/physical-geography-4133032

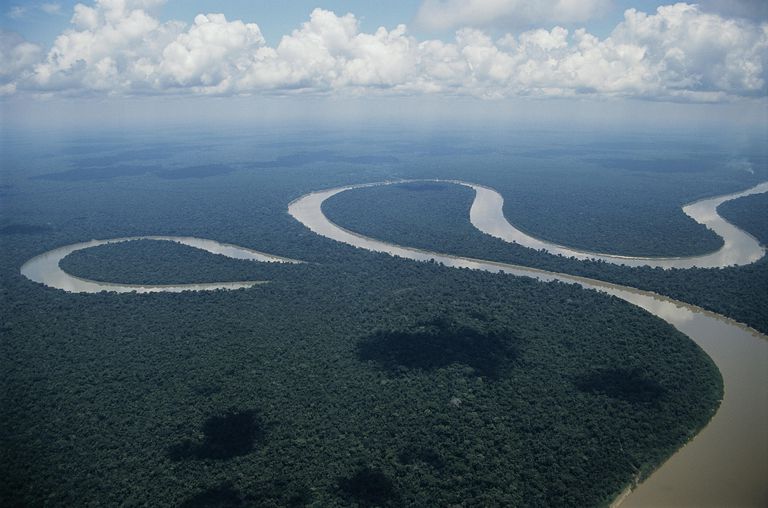
Oxbow Lake beside the Amazon River

Water in rivers flows faster on the outside of its curve than it does on the inside.  This creates erosion and decay that does not happen on the inside, creating the final curved shape.  The neck of the loop eventually erodes to the point of cutting itself off from the main river, creating the separate body of water known as the oxbow lake.  Oxbow lakes can also be initiated by humans in order to meet navigational needs.

Oxbow lakes are bodies of water that are cut off from the river in which it began.  They are unconnected but still close by since they were originally part of the river.  Oxbows get their name from the bow-like appearance of them, due to the nature of rivers’ curvature.  The water in these lakes no longer flows, but relies on precipitation, sometimes just becoming swamps.  Due to lack of outside water, these oxbow lakes often evaporate entirely within a few years of breaking off from the river.  As climate change continues to rise, these lakes will evaporate at faster rates.  This reinforces the rising issue of water scarcity and the impact that humans have on it.  In the United States, Oxbow lakes can be found along the Mississippi River and in Crater Lake, Iowa.

EPA & Urban Heat Islands

Heat islands are crucial to understand whether one is laying out the blueprint for a city, or just planning out their own home.  The EPA has dedicated a section of their website to teach the public about such heat islands.  The website is divided into two parts, the first is about understanding heat islands and the effects, and the second part is about reducing the effects of heat islands.

On the first part of the website, the EPA discusses how the dark and impervious surfaces (occurring mainly in cities and some suburban areas) reach higher surface temperatures than what the actual air temperature is.  Due to the increase in surface temperature, not only does the air temperature now slowly increase, but there is also an increase in the demand for electricity.  Since the demand for electricity goes up, the production of electricity must also go up; this in turn releases more pollutants into the atmosphere.  Heat islands and higher temperatures have also been linked to an increase in the number of hospital visits in both the young children, the elderly, and the homeless.

The second part of the website aims to inform readers about ways to reduce the effects of heat islands – such methods include planting more vegetation, both on top of and around buildings, and also using materials for pavements and roofs that reflect more energy than they absorb.  These methods to reduce the effects of heat islands are recommended on both the household level, and community level.  Further, cities and towns can change codes so that buildings comply with policies that make heat islands less prevalent.

As the younger generation seems to be the one more involved with climate change and the environment, I found it a little surprising that the EPA did not recommend any solutions for students or non-homeowners.  Just about all the suggestions to reduce the effects of heat islands were only applicable if one is a homeowner in a suburban area.  It would be beneficial for the EPA to market their solutions towards those who are most interested, yet at the same time, marketing effective solutions towards the younger generations is quite difficult given the circumstances of the problem.

Is Dry Farming the Next Wave in a Drought-Plagued World?

Dry farming is a tactic in which plants are only watered in the seedling stage and then left to the whims of nature. There is no irrigation and no rain. The plants instead must rely on their roots to bore deep into the ground and find remaining water from the past seasons. Dry farmed plants will often look dead and wilted, but their fruit can still be successful. Tomato plants were grown in California using this method. The vines of the plant were withered and brown, but the tomatoes still managed to come in full and red. This farming method relies on the plants ability to survive by finding its own supplies of water. The tomatoes grown for dry farming are closest to wild species of tomatoes. They are selected for their hardiness, but the fruit they bear is as flavorful as any other. Dry farming may serve as a key in meeting food demands during times of drought, like modern day California. This method is also important because it can help serve us in the future when climate change causes increased levels of drought.

Live Tracking of Winds, Currents, and Chemicals

https://earth.nullschool.net/#2016/12/04/2100Z/particulates/surface/level/overlay=duexttau/orthographic=-118.00,20.41,306

Earth.nullschool is a site that has an interactive map that shows the live wind currents of various altitudes and the speed of these winds. It gathers its data through GFS, NCEP, and US National Weather ServiceOne. It allows the viewer to can see the winds from surface area wind to 10 hPa. The relation of winds and humidity, precipitation, temperature, and cloud cover can also be observed through overlays. The map also has other data related to wind. It also shows the degree of Chemicals and loose particulars in the atmosphere on surface level and the wind affecting it. One can see the concentrations of Carbon Monoxide, Carbon Dioxide and sulfur dioxide at surface level. While the viewable particles consist of Sulfate and Dust Extinction.

This interactive map is not just limited to the Atmosphere. It also shows data on the Hydrosphere, specifically on the oceans. One of the maps options is viewing the waves and currents in the ocean. It also shows the sea surface temperature, temperature anomalies, and wave significance.

Although this data is interesting to view, it does not allow the collection of data and is therefore not very useful in that regard. However, it is an interesting website that allows geographers to see real time data on various subjects making it a valuable tool in that regard.

Geoguessr — Interactive Geography Game

Link: https://geoguessr.com

Geoguessr is a fun interactive game that is designed to stimulate the geography sides inside people. It utilizes the services of google maps to produce images. The user is dropped in a random location somewhere in the world. There are a myriad of types of locations that one can be dropped: middle of the ocean, national monuments, sometimes even inside of caves. One must use their knowledge and inference skills to observe their surroundings and ultimately make a guess about where in the world they have been dropped.

One should attempt to make observations about both the physical geography and human geography elements that are around them. Geoguessr tests one’s geography knowledge as one looks around their surroundings; taking note of soil color, tree type, architecture, vegetation, and landscape, in order to make a guess about where one is. To be successful, the player must pick up on various clues to help make an accurate guess. This is a very engaging and educational game!!

SNOWcast through interactive maps

Link: http://www.intellicast.com/Travel/Weather/Snow/SNOWcast.aspx

With much technology advancement, contemporary society demands more accurate weather forecasts. Of all the possible factors for weather forecast, snow forecast is one of the more important weather forecast. This is because now can have detrimental effect on transportation, outdoor activity, etc. Due to the wrong snow forecast, the Fairfax County Public School in Virginia experienced a detrimental effect of having tens of accidents around the schools. Likewise, accurate snow forecast will really help plan to prevent any devastating situation. The intellicast projects different forecasts with maps that are represented at a different angle of the weathers. For snow, it has the delay risk, travel outlook, roadway conditions, snow cover, SNOWcast, 48hr snow, 24hr snow, and many more to inform the public about the possible hazard. Such maps allow the people to easily see and accurately interpret the weather forecast. These information will further help to prevent possible hazard.