Gorillas and Vegetation in Africa’s Oldest National Park

Analyzing the Distribution of Vegetation Zones and Mountain Gorillas in Virunga National Park

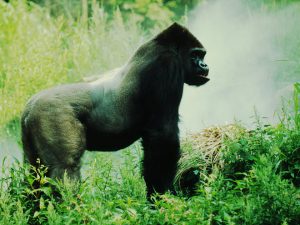
Mountain Gorilla

How are abiotic factors, vegetation zones, human activity, and distribution of mountain gorillas linked?

On National Geographic’s Website (https://www.nationalgeographic.org/activity/analyzing-distribution-vegetation-zones-and-mountain-gorillas-virunga-national-park/), there is an interactive activity in which scientists and geographers analyze Virunga National Park along the eastern edge of the Democratic Republic of the Congo along the Mitumbar Mountains. It is the oldest national park in Africa. The geography of this park ranges from grasslands and wetlands, to lava plains and natural glaciers, and is home to various species (nat.geo.org/mapmaker-abiotic-factors-virunga). 

The national park was designated in order to protect these mountain gorillas. They are omnivores but usually have plant-based diets. “Poaching, encroaching human populations, and violent conflicts in the area continue to affect mountain gorilla populations” (https://www.nationalgeographic.org/activity/analyzing-distribution-vegetation-zones-and-mountain-gorillas-virunga-national-park/ ). Illegal timber cutting is also becoming a big issue in the area. This is mappable from the site.
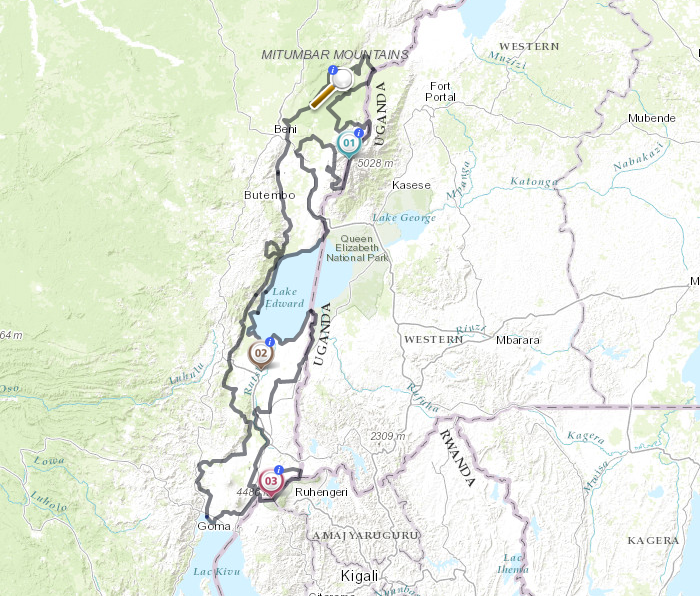
This Website shows the change in vegetation and gorilla populations in the National Park as a result of human activity. This relates to physical geography because it connects the lithosphere and biosphere between the national park territory and anthropocentric effects.

With a rise in populations it is more imperative now that people are made aware of the changes this ecosystem is experiencing due to selfish and illegal activity on supposedly-protected lands.

Website; https://www.nationalgeographic.org/activity/analyzing-distribution-vegetation-zones-and-mountain-gorillas-virunga-national-park/

 

National Geographic Encyclopedic Entries

The National Geographic encyclopedic entries page is a really useful tool for our Physical geography class since it provides various entries on class related concepts like hot spots, El Nino, earth’s crusts, continental drift, etc. It’s really easy to use, you can either enter the topic you are interested in looking for or just scroll down the pages looking for it. Each entry provides a set of images, definitions, animations, videos, background information, related material and even useful sources that connect to other articles about the subject.  There’s even a complete vocabulary tap that expands on explaining each key term’s definition and use. This would be a really useful tool to study for our final exam since you can search in a more interactive way concepts that you feel you need to look up more information about.

https://www.nationalgeographic.org/encyclopedia/

USGS Natural Hazards

The United States Geological Survey (USGS) has a section on Natural Hazards in which it discusses how every year, natural hazards threaten lives and result in billions of dollars in damage. The USGS work with many partners to monitor, assess, and conduct targeted research on a wide range of natural hazards so that policymakers and the public have the understanding and all of the knowledge they need to enable preparedness, response, and resilience.Through the Natural Hazard programs, the USGS provides alerts and warnings of geologic hazards and supports the warning responsibilities of the National Oceanic and Atmospheric Administration (NOAA) for geomagnetic storms, tsunamis, and volcanic ash.

One part of the Natural Hazards section is the Global Seismographic Network (GSN). The GSN is a permanent digital network of seismological and geophysical sensors connected by a telecommunications network. It provides, worldwide monitoring of the Earth, with over 150 modern seismic stations distributed globally. With real-time information about the status of the GSN stations and real-time recordings, we are able to know where there is seismographic activity all over the world.

Link: https://www.usgs.gov/science/mission-areas/natural-hazards?qt-mission_areas_l2_landing_page_ta=0#qt-mission_areas_l2_landing_page_ta

How Wildlife May Fare Under Trump

Link to the article: http://news.nationalgeographic.com/2016/11/wildlife-watch-trump-wildlife-trafficking-animal-conservation/

Since the recent presidency elections one of the major questions was about, what would Trump do for the environment? If he becomes the president-elect. The debates in this presidency election surround various of concerns, including some which focus on national security, trade, economics, and to a lesser degree in this election cycle, on the environment. Wildlife, however, plays a part in all those concerns.

“Given our demonstrably disastrous effects on wildlife, there is now recognition that humans have a certain obligation to protect wildlife for its own sake” (Rachel, Jani, 2016). Since 2013 president-elect Obama has worked greatly on the conservation and sustainability of nature and protection of wildlife besides that we even worked on reduction of the pollutants which effects the earth and its climate. Which shows the attempt by the president to really protect the environment for a better and sustainable future.

However, the concern now rises what is the new president-elect going to do for the environment, as some of his campaigns seemed to promote the idea of climate change being a hoax rather a real problem which deserves concern. Trump’s administration seems to promote trophy hunting and other unfriendly- environmental amendments which, may cause a disruption through out the ecosystem, especially the hydrosphere, atmosphere, and biosphere. Besides, the wall which Trump plans to build is going to disrupt the ecosystem especially the biosphere as its going to hinder animal migration which might end up being a cause for the extinction of these animals.

Stanford University Spatial History Project

The Spatial History Project is an attempt to conduct research within the humanities, specifically history, through the lens of spatial analysis. The team compiles both spatial and non spatial data together within geospatial databases. The differentiation between the Spatial History Project and traditional history research lies in several factors, including the fact that it places a strong emphasis on visualization, a conceptual approach to space, is more collaborative and depends heavily on the use of computers. The website allows you to access the research put out by the Project, as well as look at current projects. Some projects that are currently underway include A Chronology of Suburban Expansion for San Antonio, TexasA Global Atlas of OilFollow the Money, and From Forest to Vineyards: The Changing Landscape in Brazil, among many others. All of these projects begin by examing a central historical issue, and then trace itsdevelopment using geospatial methods. This provides a unique perspective on historical inquiry. The website also allows you to go into the gallery of past projects and immerse yourselg in the research through the use of visals and other forms of media. The research falls within the cross section of the biosphere and lithosphere, lookig both and human interaction and developent with nature as well as the pure enviornmental development over time. In all this website is a useful and intriguing resource for anyone from history buffs to budding physical geographists. 

http://web.stanford.edu/group/spatialhistory/cgi-bin/site/index.php

Plate Tectonics Map

This map, provided by Geography.com is an interactive map of the major Tectonic plates of the world and how/when they are known to move. Each dropped pin states the name of the plate as well as it’s recent history.

It also designates whether or not it is a plate boundary and specifies the difference between volcanic chains, faults, and other tectonic movement/action. It also has links to informative articles on the different plate types and different fault lines around the world.

It also details the different types of boundaries (divergent, convergent, transform) and teaches about Earth’s Internal Structure.

Overall, a very useful website for those looking to better understand Plate Tectonics and how/where they affect the world.


Link: http://geology.com/plate-tectonics.shtml


Live Earthquakes Map

Website: http://quakes.globalincidentmap.com/

This website maps earthquakes from around the world using data from the US Geological Survey feed. It provides information about the location, the date and time (including how long ago it happened from the current viewing time),  the magnitude, and the depth of the quake in a table below the map. On the map itself, dots corresponding to the magnitude of the earthquake are placed at the geographic location of the quake, providing a clear visual display of where recent earthquakes have occurred.

This website clearly relates to our class discussion on the lithosphere and earthquakes specifically. Being able to visualize the location and magnitude of recent quakes drives home the theory of plate tectonics (thanks Alfred Wegener) because you can see that earthquakes most often occur along certain, invisible boundaries. I also like that this map shows how frequently earthquakes occur, even smaller ones that are not necessarily detectable without technology. I think this drives home the point that earthquakes are a common phenomenon that frequently, and often heavily, impact human life.

How much do you know about volcanoes?


Have you ever wondered how many volcanoes there are in your country, or how many earthquakes have occurred in the past 24 hours? Have you ever wanted to travel and see a volcano, but you don’t know where to start? www.volcanodiscovery.com is a great website if you want to know anything and everything about the geography of volcanoes. When you first go to the website, there are simple categories on what you are specifically looking for. For example, if you click on the first box that says “Volcanoes of the world,” there is information and news about active volcanoes from all around the world. You could click on a country such as Japan, for example, to find out how many volcanoes are on that island, and find out facts about them. You could also click on the category called “Volcano photos,” to see magnificent photographs of different types of active volcanoes. There is also a “photo of the day” category, in which you could check back every day to see a new photo. Another interesting category is the “Volcano travel,” in which you could find out where you can visit to see volcanoes. There are even specific dates and tours that you could sign up for. Another category that is convenient is the “Latest earthquakes” category. Here, you can find out the latest earthquakes from around the world and their magnitudes.

Cold to Hot! A study of How the Ice-covered Earth Heated Up To Record Temperatures

Researchers at the University of Texas — Austin Jackson School of the Geosciences have recently conducted a study, featured in the April 22, 2016, edition of Science, hypothesizing that volcanic activity associated with plate tectonic movement is a contributing factor to the global climatic shift to higher temperatures. This study analyzes shifts in the Earth’s baseline climate throughout Earth’s 4.6 billion year existence; the study focuses on long-term shift, not short-term/human-induced climate change. The researchers, using a geomorphological lens to examine climate change shifts concluded, ” periods when volcanoes along continental arcs were more active coincided with warmer, or greenhouse, conditions over the past 720 million years. Conversely,  periods when continental arc volcanos were less active coincided with colder, or icehouse, conditions” (University of Texas at Austin). The research team argues that when crustal collisions occur throughout Earth’s history, the effects of plates colliding can increase Earth’s temperatures, especially collisions that result in volcano formation.

Continental arc systems, the researchers argue, act as reservoir for carbon, until volcanic eruption releases carbon into the atmosphere. Continental arc systems are created by the collision of two tectonic plates and the oceanic plate is subverted by the continental plate, forming a subduction zone where magma mixes with trapped carbon to release carbon dioxide when volcanoes erupt.  The amount of carbon dioxide released and held in the atmosphere “influences Earth’s climate.” The research team compiled over 200 published studies, in addition to their own data, to study the past 720 million years of Earth’s geology. The team constructed a global database cataloging the most recent 720 million years of volcanic activity at the margins of the continental plates. The study also examined other greenhouse gases and sediment basins of eroded volcanic structures in order to improve their model.

In concluding statements, team contributor Brian Horton stated, “the cooler icehouse periods tended to correlate with the assembly of the Earth’s supercontinents, which was a time of diminished continental volcanism. The warmer greenhouse periods correlated with continental breakup, a time of enhanced continental volcanism.” This study is important to physical geography because it is representative of the interconnectedness and interdependence Earth’s systems have with one another. The lithosphere and the atmosphere are not independent of each other, but exogenic processes that occur in one sphere or system of the Earth affects the other system.

Source: https://www.sciencedaily.com/releases/2016/04/160421150056.htm


Rocks Reveal New, Ancient Super Continent

University of Wyoming Researcher, Kevin Chamberlain, has helped disprove a previously wide-held theory of two Precambrian super continents (called Nuna-Columbia and Rodinia) using a technique called “diking,” which examines specific types of layers in rocks called dikes. Chamberlain examined “mafic” dikes in layers of rock, which are dark bands of mineral or rock containing magnesium and iron that form between existing, older rocks. Chamberlain found similar dike swarms (cluster of dikes within the continental crust) in the Southern regions of Siberia and mountain ranges of Wyoming, as well as similar ages of cratons and dike swarms in the two regions. This helped determine when and where the cratons split apart and caused continent reformation, which proved that the Southern region of Siberia and the core of North America where Wyoming’s mountain ranges fall were connected at one point. The findings helped Chamberlain conclude that these regions were connected for about 1.2 billion years, anywhere from 1.9 to 700 million years ago, as one of four or five hypothesized super continent cycles.

The discovery also brought good news to the futures of mining companies. The uncovering of similar dike swarms and craton ages in the two geographic regions reveal that large metal deposits are likely to exist under the younger layers of rock.

Find the article at : https://www.sciencedaily.com/releases/2016/04/160412091348.htm