Eclipse!

In case you don’t know, there’s a total eclipse coming to North America next year, on August 21 to be precise. You can find lots of information about it by Googling, naturally.

You’ll only be able to see a total eclipse along a certain path through the US. I wanted to know where on the path I should go. In particular, where is the weather most likely to be clear on that day?

I asked my brother, who’s a climate scientist, where to go to find this out. He pointed me to the cloud fraction data from NASA’s MODIS TERRA/AQUA sensor, which contains whole-earth cloud cover maps. Here’s the answer:

usa

The red curve is the middle of the path of totality of the eclipse. The eclipse will be total over a band of maybe 30-50 miles on either side. The colors show average cloud cover. Black is good and white is bad.

(In case you’re dying to know the details, here they are. I grabbed the data for the past 10 years for the time around August 21. The most sensible data product to use seems to be the 8-day averages. August 21 is right on the edge of one of those 8-day windows, so I took the two eight-day windows on either side, and averaged together those 20 maps.)

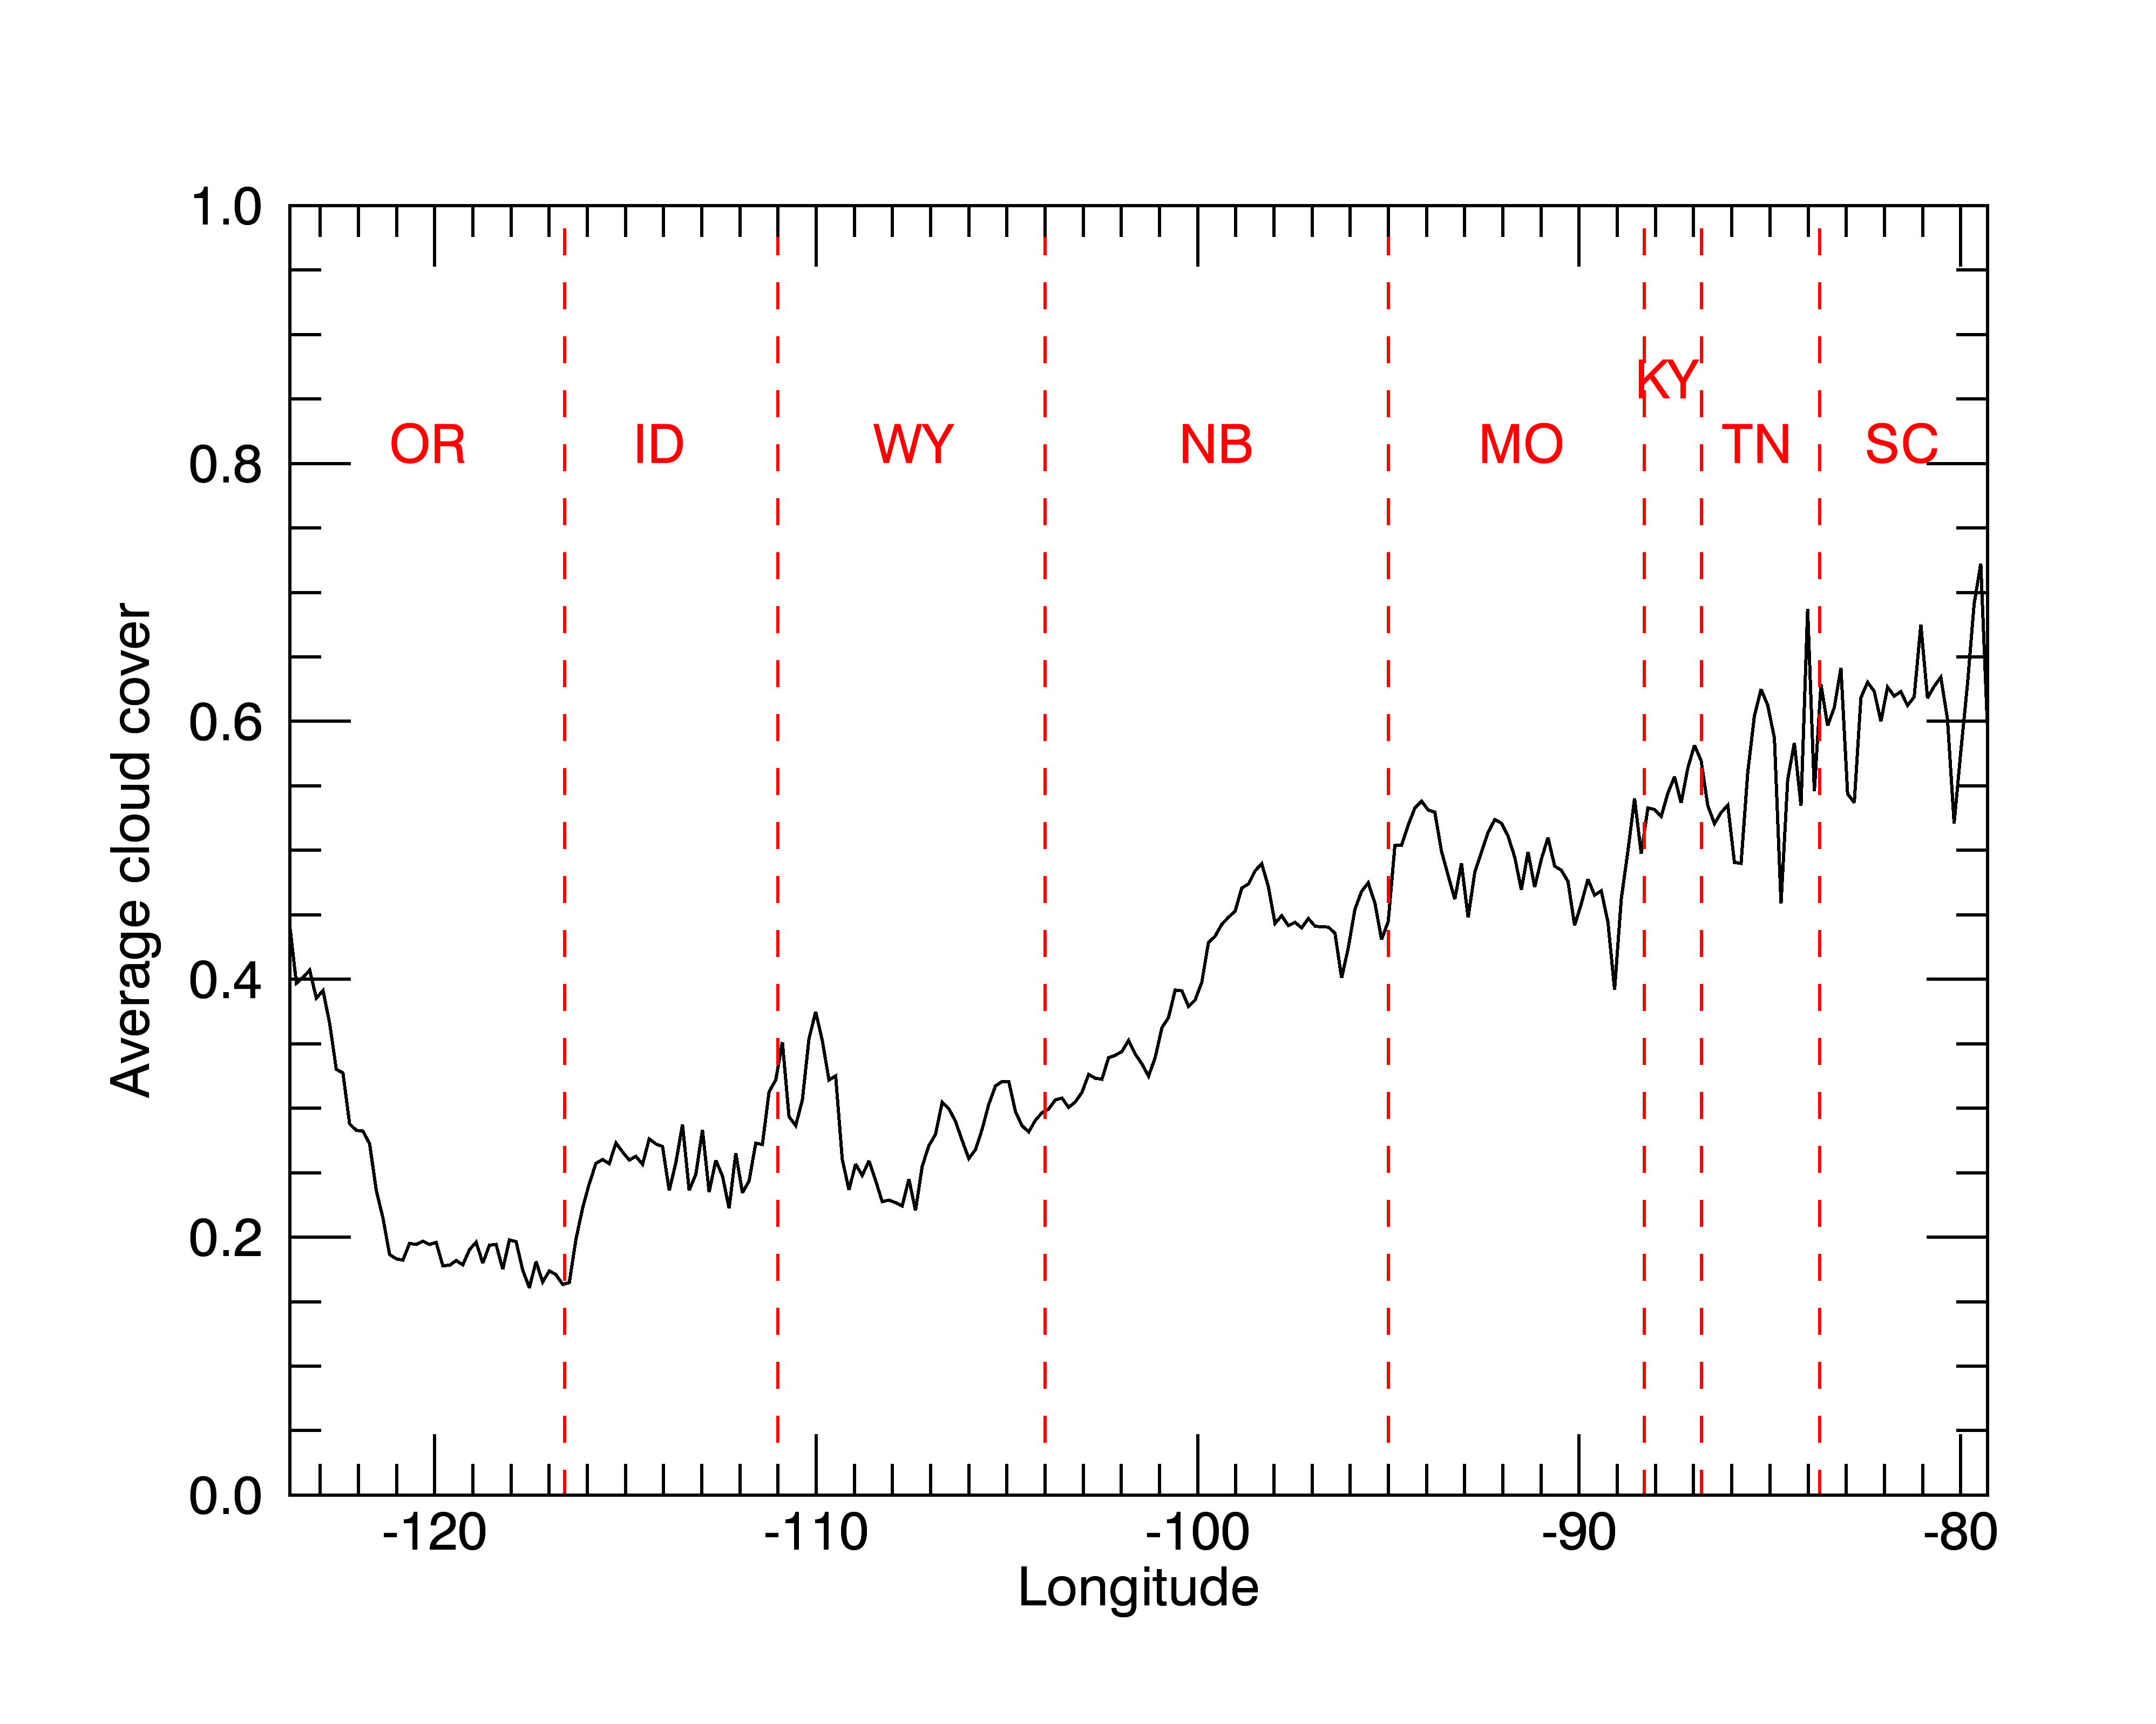
Here’s another way to look at it: a graph of average cloud cover along the path of totality, across the US. The red dashed lines show state boundaries. The path clips little corners of Kansas, Illinois, and North Carolina, which I didn’t bother to mark.


longgraph

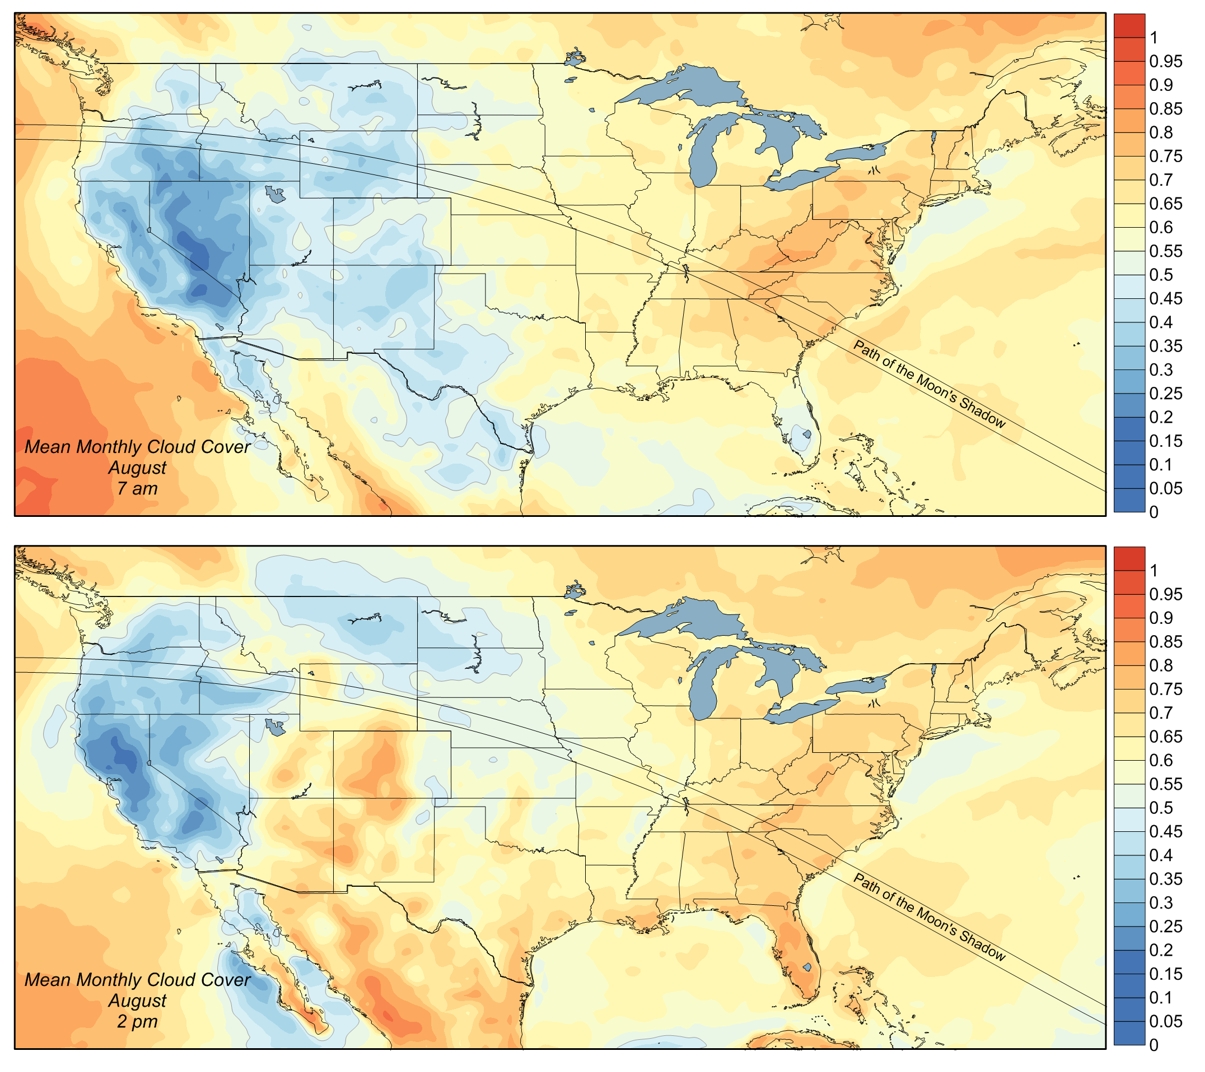
After making my map, I found this one, which reaches similar conclusions.


cloudmaps

Hotel rooms along the path of totality are already hard to find. Make your plans right away!

We still don’t know if there have been alien civilizations

Pedants (a group in which I have occasionally been included) often complain that nobody uses the phrase “beg the question” correctly anymore. It’s supposed to refer to the logical fallacy of circular reasoning — that is, of assuming the very conclusion for which you are arguing. Because the phrase is so often used to mean other things, you can’t use it in this traditional sense anymore, at least not if you want to be understood.

I’ve never found this to be a big problem, because the traditional meaning isn’t something I want to talk about very often. Until today.

The article headlined Yes, There Have Been Aliens in today’s New York Times is the purest example of question-begging I’ve seen in a long time. The central claim is that “we now have enough information to conclude that they [alien civilizations] almost certainly existed at some point in cosmic history.”

The authors use a stripped-down version of the Drake equation, which is the classic way to talk about the number of alien civilizations out there. The Drake equation gives the expected number of alien civilizations in our Galaxy in terms of a bunch of probabilities and related numbers, such as the fraction of all stars that have planets and the fraction of planets on which life evolves. Of course, we don’t know some of these numbers, particularly that last one, so we can’t draw robust conclusions.

The authors estimate that “unless the probability for evolving a civilization on a habitable-zone planet is less than one in 10 billion trillion, then we are not the first” such civilization. Based on this number, they conclude that ” the degree of pessimism required to doubt the existence, at some point in time, of an advanced extraterrestrial civilization borders on the irrational.”

Nonsense. It’s not the least bit irrational to believe that this probability is so low. We have precisely no evidence as to the value of the probability in question. Any conclusion you draw from this value is based solely on your prior (evidence-free) estimate of the probability.

I mean the phrase “evidence-free” in a precise Bayesian sense: All nonzero values of that probability are equally consistent with the world we observe around us, so no observation causes us to prefer any value over another.

They’d revoke my Bayesian card if I didn’t point out that there’s no problem with the fact that your conclusions depend on your prior probabilities. All probabilities do (with the possible exception of statements about pure mathematics and logic). But it’s absurd to say that it’s “irrational” to believe that the probability is below a certain value, when your assessment of that probability is determined entirely by your prior beliefs, with no contribution from actual evidence.

This sort of argument is occasionally known as “proof by Goldberger’s method“:

The proof is by the method of reductio ad asburdum. Suppose the result is false. Why, that’s absurd! QED.


Electability update

As I mentioned before, a fair amount of conversation about US presidential politics, especially at this time in the election cycle, is speculation about the “electability” of various candidates. If your views are aligned with one party or the other, so that you care more about which party wins than which individual wins, it’s natural to throw your support to the candidate you think is most electable. The problem is that you may not be very good at assessing electability.

I suggested that electability should be thought of as a conditional probability: given that candidate X secures his/her party’s nomination, how likely is the candidate to win the general election? The odds offered by the betting markets give assessments of the probabilities of nomination and of victory in the general election. By Bayes’s theorem, the ratio of the two is the electability.

Here’s an updated version of the table from my last post, giving the candidates’ probabilities:

PartyCandidateNomination ProbabilityElection ProbabilityElectability
DemocratClinton70.54463
DemocratSanders28.519.568
RepublicanBush8.53.541
RepublicanCruz13.55.40
RepublicanRubio32.51546
RepublicanTrump47.5
29.562

As before, these are numbers from PredictIt, which is a betting market where you can go wager real money.

If you use numbers from PredictWise, they look quite different:

PartyCandidateNomination ProbabilityElection ProbabilityElectability
DemocratClinton845363
DemocratSanders16850
RepublicanBush7343
RepublicanCruz8225
RepublicanRubio321341
RepublicanTrump511835

PredictWise aggregates information from various sources, including multiple betting markets as well as polling data. I don’t know which one is better. I do know that if you think PredictIt is wrong about any of these numbers, then you can go there and place a bet. Since PredictWise is an aggregate, there’s no correspondingly obvious way to make money off of it. If you do think the PredictWise numbers are way off, then it’s probably worth looking around at the various betting markets to see if there are bets you should be making: since PredictWise got its values in large part from these markets, there may be.

To me, the most interesting numbers are Trump’s. Many of my lefty friends are salivating over the prospect of his getting the nomination, because they think he’s unelectable. PredictIt disagrees, but PredictWise agrees. I don’t know what to make of that, but it remains true that, if you’re confident Trump is unelectable, you have a chance to make some money over on PredictIt.

My old friend John Stalker, who is an extremely smart guy, made a comment on my previous post that’s worth reading. He raises one technical issue and one broader issue.

The technical point is that whether you can make money off of these bets depends on the bid-ask spread (that is, the difference in prices to buy or sell contracts). That’s quite right.  I would add that you should also consider the opportunity cost: if you make these bets, you’re tying up your money until August (for bets on the nomination) or November (for bets on the general election). In deciding whether a bet is worthwhile, you should compare it to whatever investment you would otherwise have made with that money.

John’s broader claim is that “electability” as that term is generally understood in this context means something different from the conditional probabilities I’m calculating:

I suspect that by the term “electability” most people mean the candidate’s chances of success in the general election assuming voters’ current perceptions of them remain unchanged, rather than their chances in a world where those views have changed enough for them to have won the primary.

You should read the rest yourself.

I think that I disagree, at least for the purposes that I’m primarily interested in. As I mentioned, I’m thinking about my friends who hope that Trump gets the nomination because it’ll sweep a Democrat into the White House. I think that they mean (or at least, they should mean) precisely the conditional probability I’ve calculated. I think that they’re claiming that a world in which Trump gets the nomination (with whatever other events or changes go along with that) is a world in which the Democrat wins the Presidency. That’s what my conditional probabilities are about.

But as I said, John’s an extremely smart guy, so maybe he’s right and I’m wrong.

Horgan on Bayes

John Horgan has a piece at Scientific American‘s site entitled “Bayes’s Theorem: What’s the Big Deal?” The article’s conceit is that, after hearing people touting Bayesian reasoning to him for many years, he finally decided to learn what it was all about and explain it to his readers.

His explanation is not bad at first. He gets a lot of it from this piece by Eliezer Yudkowsky, which is very good but very long. (It does have jokes sprinkled through it, so keep reading!) Both Yudkowsky and Horgan emphasize that Bayes’s theorem is actually rather obvious. Horgan:

This example [of the probability of false positives in medical tests] suggests that the Bayesians are right: the world would indeed be a better place if more people—or at least more health-care consumers and providers–adopted Bayesian reasoning.

On the other hand, Bayes’ theorem is just a codification of common sense. As Yudkowsky writes toward the end of his tutorial: “By this point, Bayes’ theorem may seem blatantly obvious or even tautological, rather than exciting and new. If so, this introduction has entirely succeeded in its purpose.”

That’s right! Bayesian reasoning is simply the (unique) correct way to reason quantitatively about probabilities, in situations where the experimental evidence doesn’t let you draw conclusions with mathematical certainty (i.e., pretty much all situations).

Unfortunately, Horgan eventually goes off the rails:

The potential for Bayes abuse begins with P(B), your initial estimate of the probability of your belief, often called the “prior.” In the cancer-test example above, we were given a nice, precise prior of one percent, or .01, for the prevalence of cancer. In the real world, experts disagree over how to diagnose and count cancers. Your prior will often consist of a range of probabilities rather than a single number.

In many cases, estimating the prior is just guesswork, allowing subjective factors to creep into your calculations. You might be guessing the probability of something that–unlike cancer—does not even exist, such as strings, multiverses, inflation or God. You might then cite dubious evidence to support your dubious belief. In this way, Bayes’ theorem can promote pseudoscience and superstition as well as reason.

The problem he’s talking about is, to use a cliche, not a bug but a feature. When the evidence doesn’t prove, with mathematical certainty, whether a statement is true or false (i.e., pretty much always), your conclusions must depend on your subjective assessment of the prior probability. To expect the evidence to do more than that is to expect the impossible.

In the example Horgan is using, suppose that a cancer test is given with known rates of false positives and false negatives. The patient tests positive. In order to interpret that result and decide how likely the patient is to have cancer, you need a prior probability. If you don’t have one based on data from prior studies, you have to use a subjective one.

The doctor and patient in such a situation will, inevitably, decide what to do next based on some combination of the test result and their subjective prior probabilities. The only choice they have is whether do it unconsciously or consciously.

The second paragraph quoted above is simply nonsense. If you apply Bayesian reasoning to any of those things that may or may not exist, you will reach conclusions that combine your prior belief with the evidence. I have no idea in what sense doing this “promote[s] pseudoscience.” More importantly, I have no idea what alternative Horgan would have us choose.

Here’s the worst part of the piece:

Embedded in Bayes’ theorem is a moral message: If you aren’t scrupulous in seeking alternative explanations for your evidence, the evidence will just confirm what you already believe. Scientists often fail to heed this dictum, which helps explains why so many scientific claims turn out to be erroneous. Bayesians claim that their methods can help scientists overcome confirmation bias and produce more reliable results, but I have my doubts.

Horgan doesn’t cite any examples of erroneous claims that can be blamed on Bayesian reasoning. In fact, this statement seems to me to be nearly the exact opposite of the truth.

There’s been a lot  angst in the past few years about non-replicable scientific findings. One of the main contributors to this problem, as far as I can tell, is that scientists are not using Bayesian reasoning: they are interpreting p-values as if they told us whether various hypotheses are true or not, without folding in any prior information.

The world is getting better, in at least one way

I’m checking the page proofs for an article that my student Haonan Liu and I have had accepted for publication in Physical Review D. I’ve worked with dozens of undergraduates on research projects over the years, and this is by far the most substantial work ever done by any of them. Huge congratulations to Haonan! (And to my friends on admissions committees for physics Ph.D. programs: look out for this guy’s application.)

Incidentally, we submitted this article before the Open Journal for Astrophysics opened its doors, so this isn’t the one I referred to in my last post. That one isn’t finished yet.

Along with the page proofs come a few comments and queries from the editors, to make sure that the published version of the article looks correct. That document says, in part,

The editors now encourage insertion of article titles in references to journal articles and e-prints.

If you’re not in physics or astronomy, this sentence probably seems strange: how could you possibly not include the titles of articles? If you do work in physics or astronomy, you’ve probably gotten used to the fact that we generally don’t give titles in citations, but this is an incredibly stupid thing. When you’re reading a paper, and you have to decide if it’s worth the bother of looking up a cited article, the title might actually be useful information! Other disciplines include titles. I’ve never understood why we don’t. Thank you to Physical Review for this bit of sanity.

Here’s what a bit of the bibliography originally looked like:

Screenshot 2015-12-30 15.48.15


Now it’ll be

Screenshot 2015-12-30 15.48.33

Much better!

Of course, the standard LaTeX styles used for formatting articles for publication in physics journals don’t include article titles, so including them at this stage actually took a bit of effort on my part, but I was glad to do it. I hope other journals follow this practice. Maybe I’ll mention it to someone on the board of the Open Journal.

The Open Journal of Astrophysics

I’m pleased to point out that the Open Journal of Astrophysics is now open for submissions. Editor-in-chief Peter Coles has all the details. I’m a member of the editorial board of this new journal, although I confess that I have done nothing to help with it so far.

The journal performs peer review like other scholarly journals. Articles in it are published on the arxiv (where most astrophysics articles get posted anyway). The journal does not have the overhead of publishing in the traditional way, so it is free for both authors and readers.

I find the economics of traditional scholarly journals utterly baffling. As Coles observes, “The only useful function that journals provide is peer review, and we in the research community do that (usually for free) anyway.” I hope that efforts like this one will point the way to a more efficient system. I urge my astrophysics colleagues to submit articles to it.

Now let me confess to a bit of hypocrisy, or at least timidity. I’m hoping to submit an article for publication in the next few weeks, and I’m planning to send it to an established journal, not the Open Journal. The only reason is that I expect to apply for promotion (from Associate Professor to Full Professor) this summer, and I think there’s a significant possibility that some of the people evaluating my application will be more impressed by an established journal, with all the various accoutrements such as impact factors that go along with it.

This is quite possibly the last time in my career that I’ll have to worry about this sort of thing. In general, I care about the opinions of people who have actually read my work and formed a judgment based on its merits. Such people don’t need to rely on things like impact factors, which are a terribly stupid way to evaluate quality. So after this one, I’ll promise to submit future articles to the Open Journal (unless I have coauthors whom I can’t persuade to do it, I guess).


Which candidates are most electable, according to the market?

When people talk about US politics, they often focus on the various candidates’ “electability”. In particular, they talk about basing their support for a given candidate in the primary on how likely that candidate is to win the election.

This is a perfectly reasonable thing to think about, of course. If your primary goal is, say, to get a Democrat into the White House, then it makes sense to pick the Democrat who’s most likely to get there, even if that’s not your favorite candidate. The only problem is that, I suspect, people are often quite bad at guessing who’s the most electable candidate.

Eight years ago, I observed (1,2,3) that there is one source of data that might help with this, namely the political futures markets. These are sites where bettors can place bets on the outcomes of the elections. The odds available on the market at any given time show the probabilities that the bettors are willing to assign to the various outcomes. For instance, as of yesterday, at the PredictIt market, you could place a bet of $88 that would pay off $100 if Hillary Clinton wins the Democratic nomination. This means that the market “thinks” Clinton has an 88% chance of getting the nomination.

To assess a candidate’s electability, you want the conditional probability that the candidate wins the election, if he or she wins the nomination. The futures markets don’t tell you those probabilities directly, but you can get them from the information they do give.

Here’s a fundamental law of probability:

P(X becomes President) = P(X is nominated) * P(X becomes President, given that X is nominated).

The last term, the conditional probability, is the candidate’s “electability”. PredictIt lets you bet on whether a candidate will win the nomination, and on whether a candidate will win the general election. The odds for those bets tell you the other two probabilities in that equation, so you can get the electability simply by dividing one by the other.

So, as of Saturday, December 5, here’s what the PredictIt investors think about the various candidates:

PartyCandidateNomination ProbabilityElection ProbabilityElectability
DemocratClinton88.5
57.565
DemocratSanders12.56.552
RepublicanBush9.54.547
RepublicanCruz25.510.541
RepublicanRubio39.519.549
RepublicanTrump25.515.561

(In case you’re wondering, the 0.5’s are because PredictIt has a 1% difference between the buy and sell prices on all these contracts. I went with the average of the two. They include other candidates, with lower probabilities, but I didn’t include them in this table.)

I’ve heard lots of people on the left say that they hope Donald Trump wins the nomination, because he’s unelectable — that is, the Democrat would surely beat him in the general election. I don’t know if that’s true or not, but it’s sure not what this market is saying.

Of course, the market could be wrong. If you think it is, then you have a chance to make some money. In particular, if you do think that Trump is unelectable, you can go place a bet against him to win the general election.

To be more specific, suppose that you are confident the market has overestimated Trump’s electability. That means that they’re either overestimating his odds of winning the general election, or they’re underestimating his odds of getting the nomination. If you think you know which is wrong, then you can bet accordingly. If you’re not sure which of those two is wrong, you can place a pair of bets: one that he’ll lose the general election, and one that he’ll win the nomination. Choose the amounts to hedge your bet, so that you break even if he doesn’t get the nomination. This amounts to a direct bet on Trump’s electability. If you’re right that his electability is less than 61%, then this bet will be at favorable odds.

So to all my lefty friends who say they hope Trump wins the nomination, so that Clinton (or Sanders) will stroll into the White House, I say put your money where your mouth is.

 

That error the “hot hands” guys say that everyone makes? Turns out nobody makes it

A followup to this post.

First, a recap. Last month, there was an article in the New York Times touting a working paper by Miller and Sanjurjo. The paper claimed that various things related to the gambler’s fallacy could be explained by a certain (supposedly) counterintuitive fact about probabilities. In particular, it claimed that past attempts to measure the “hot hands” phenomenon (the perception that, say, basketball players are more likely to make a shot when they’ve made their previous shots) were tainted by a mistaken intuition about probabilities.

The mathematical result described in the paper is correct, but I was very dubious about the claim that it was counterintuitive, and also about the claim that it was responsible for errors in past published work.

To save you the trouble of following the link, here are some excerpts from my previous post:

Suppose you flip a coin four times. Every time heads comes up, you look at the next flip and see if it’s heads or tails. (Of course, you can’t do this if heads comes up on the last flip, since there is no next flip.) You write down the fraction of the time that it came up heads. For instance, if the coin flips went HHTH, you’d write down 1/2, because the first H was followed by an H, but the second H was followed by a T.

You then repeat the procedure many times (each time using a sequence of four coin flips). You average together all the results you get. The average comes out less than 1/2.

I guess that might be a counterintuitive result. Maybe. Personally, I find the described procedure so baroque that I’m not sure I would have had any intuition at all as to what the result should be.

My question is whether the average-of-averages procedure described in the article actually corresponds to anything that any actual human would do.

According to the Miller-Sanjurjo paper, in previous published work,

The standard measure of hot hand effect size in these studies is to compare the empirical probability of a hit on those shots that immediately follow a streak of hits to the empirical probability of a hit on those shots that immediately follow a streak of misses.

If someone did that for a bunch of different people, and then took the mean of the results, and expected that mean to be zero in the absence of a hot-hands effect, they would indeed be making the error Miller and Sanjurjo describe, because it’s true that these two means differ for the reason described in the paper. So does anyone actually do this?

The sentence I quoted above cites three papers. I don’t seem to have full-text access to one of them, but I looked at the other two. One of them (Koehler and Conley) contains nothing remotely like the procedure described in this working paper. Citing it in this context is extremely misleading.

The other one (Gilovich et al.) does indeed calculate the probabilities described in the quote, but (a) that’s just one of many things it calculates, and (b) they never take the mean of the results. Fact (a) casts doubt on the claim that this is “the standard measure” — it’s a tiny fraction of what Gilovich et al. talk about — and (b) means that they don’t make the error anyway.

The relevant section of Gilovich et al. is Table 4, which tallies the results of an experiment in which Cornell basketball players attempted a sequence of 100 free throws each. The authors calculate the probabilities of getting a hit after a sequence of hits and after a sequence of misses, and note little difference between the two. Miller and Sanjurjo’s main point is that the mean of the differences should be nonzero, even in the absence of a “hot hands” effect. That’s true, but since Gilovich et al. don’t base any conclusions on the mean, it’s irrelevant.

Gilovich et al. do talk about the number of players with a positive or negative difference, but that’s different from the mean. In fact, the median difference between the two probabilities is unaffected by the Miller-Sanjurjo effect (in a simulation I did, it seems to be zero in the absence of a “hot hands” effect), so counting the number of players with positive or negative differences seems like it might be an OK thing to do.

In any case, Gilovich et al. draw their actual conclusions about this study from estimates of the serial correlation, which is an unimpeachably sensible thing to do, and which is unaffected by the Miller-Sanjurjo effect.

So I can find no evidence that anyone actually makes the error that Miller and Sanjurjo claim to be widespread. Two of the three papers they cite as examples of this error are free of it. I couldn’t check the third. I suppose I could get access to it with more effort, but I’m not going to bother.

A milestone for UR Physics

Check out this list produced by the American Institute of Physics:

bachdegrees

This is the first time we’ve made the list. As department chair, I’d like to take credit for the accomplishment, but a close reading of the data will reveal that it all happened before I took over. Everyone in the department has worked hard to build our program, but particular credit has to go to the two previous department chairs, Jerry Gilfoyle and Con Beausang.


Another strange NY Times article about probability

Oddly enough, I still read the Sunday New York Times on paper. As a result, I was extremely confused by George Johnson’s article headlined Gamblers, Scientists, and the Mysterious Hot Hand.

The heart of the article is this claim:

In a study that appeared this summer, Joshua B. Miller and Adam Sanjurjo suggest why the gambler’s fallacy remains so deeply ingrained. Take a fair coin — one as likely to land on heads as tails — and flip it four times. How often was heads followed by another head? In the sequence HHHT, for example, that happened two out of three times — a score of about 67 percent. For HHTH or HHTT, the score is 50 percent.

Altogether there are 16 different ways the coins can fall. I know it sounds crazy but when you average the scores together the answer is not 50-50, as most people would expect, but about 40-60 in favor of tails.

Maybe it’s just me, but I couldn’t make sense of this claim. The online version has a graphic that clears it up. The last sentence is literally correct (with the possible exception of the phrase “as most people would expect,” as I’ll explain), but I couldn’t manage to parse it. I wonder if it was just me.

Here’s my summary of exactly what is being said:

Suppose you flip a coin four times. Every time heads comes up, you look at the next flip and see if it’s heads or tails. (Of course, you can’t do this if heads comes up on the last flip, since there is no next flip.) You write down the fraction of the time that it came up heads. For instance, if the coin flips went HHTH, you’d write down 1/2, because the first H was followed by an H, but the second H was followed by a T.

You then repeat the procedure many times (each time using a sequence of four coin flips). You average together all the results you get. The average comes out less than 1/2.

I guess that might be a counterintuitive result. Maybe. Personally, I find the described procedure so baroque that I’m not sure I would have had any intuition at all as to what the result should be. Hence my skepticism about the “as most people would expect” phrase. I think that if you took a survey, you’d get something like this:

survey

(And, by the way, I don’t mean this as an insulting remark about the average person’s mathematical skills: I think I would have been in the 90%.)

The reason you don’t get 50% from this procedure is that it weights the outcomes of individual flips unevenly. For instance whenever HHTH shows up, the HH gets an effective weight of 1/2 (because it’s averaged together with the HT). But in each instance of HHHH, each of the three HH’s gets an effective weight of 1/3 (because there are three of them in that sequence). The correct averaging procedure is to count all the individual instances of the things you’re looking for (HH’s); not to group them together, average those, and then average the averages.

My question is whether the average-of-averages procedure described in the article actually corresponds to anything that any actual human would do.

The paper Johnson cites (which, incidentally, is an non-peer-reviewed working paper) makes grandiose claims about this result. For one thing, it is supposed to explain the “gambler’s fallacy.” Also, supposedly some published analyses of the “hot hands” phenomenon in various sports are incorrect because the authors used an averaging method like this.

At some point, I’ll look at the publications that supposedly fall prey to this error, but I have to say that I find all this extremely dubious. It doesn’t seem at all likely to me that that bizarre averaging procedure corresponds to people’s intuitive notions of probability, nor does it seem likely that a statistician would use such a method in a published analysis.