A colleague pointed me to an article by Valen Johnson called An alternative to traditional GPA for evaluating student performance, because the article takes a Bayesian approach, and he knew I liked that sort of thing.
Johnson addresses the problem that a student’s grade point average (GPA), the standard measure of academic quality in US educational institutions, doesn’t necessarily give fair or useful results. Some instructors, and even some entire disciplines, on average grade higher than others, so some students are unfairly penalized / rewarded in their GPAs based on what they choose to study.
To illustrate the problem, Johnson uses an example taken from an earlier paper by Larkey and Caulkin. I’d never seen this before, and I thought it was cute, so I’m passing it on.
Imagine that four students take nine courses, receiving the following grades:
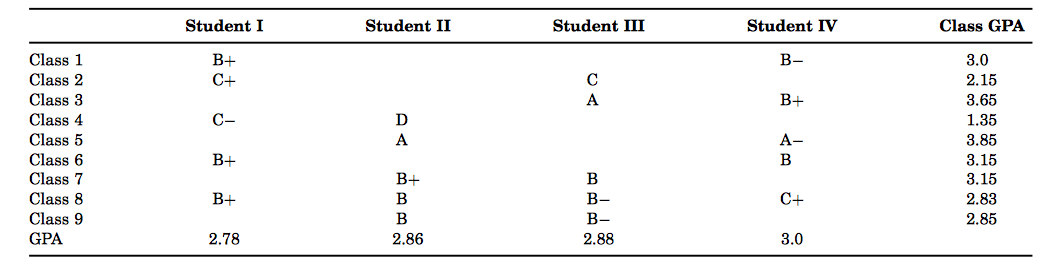
In this scenario, every individual course indicates that the ranking of the students is I, II, III, IV (from best to worst). That is, in every course in which students I and II overlap, I beats II, and similarly for all other pairs. But the students’ GPAs put them in precisely the opposite order.
This is a made-up example, of course, but it illustrates the idea that in the presence of systematic differences in grading standard, you can get anomalous results.
This example tickles my love of math puzzles. If you’d asked me whether it was possible to construct a scenario like this, I think I would have said no.
There are obvious follow-up questions, for those who like this sort of thing. Could you get similar results with fewer courses? If you had a different number of students, how many courses would you need to get this outcome?
I know the answer for the case of two students. If you allow for courses with only one student in them, then it’s easy to get this sort of inversion: have the students get a C+ and a C respectively in one course, and then give student II an A in some other course. If you don’t allow one-student courses, then it’s impossible. But as soon as you go up to three students, I don’t think the answer is obvious at all.
As I said, I was mostly interested in this curious puzzle, but in case you’re curious, here are a few words about the problem Johnson is addressing. I don’t have much to say about it, because I haven’t studied the paper in enough detail.
Some people have proposed that a student’s transcript should include statistical information about the grade distribution in each of the student’s courses, so that anyone reading the transcript will have some idea of what the grade is worth. For what it’s worth, that strikes me as a sensible thing to do, although getting the details right may be tricky.
That only solves the problem if the person evaluating the student (prospective employer, graduate program, or the like) is going to take the time to look at the transcript in detail. Often, people just look at a summary statistic like GPA. Johnson proposes a way of calculating a quantity that could be considered an average measure of student achievement, taking into account the variation in instructors’ grading habits. Other people have done this before, or course. Johnson’s approach is different in that it’s justified by Bayesian probability calculations from a well-specified underlying model, as opposed to more-or-less ad hoc calculations.
I’m philosophically sympathetic to this approach, although some of the details of Johnson’s calculations seem a bit odd to me. I’d have to study it much more carefully than I intend to to say for sure what I think of it.
For three students (call them X, Y, Z), you can get the same effect as follows:
Class 1: X = D+, Y = D (class GPA = 1.15)
Class 2: X = C+, Y = C (class GPA = 2.15)
Class 3: Y = A, Z = A- (class GPA = 3.85)
X GPA = 1.8
Y GPA = 2.5
Z GPA = 2.85
In general, you keep the grades in a tight band within each class, while making the overall class GPA vary inversely with the quality of the students taking the class.
Oops typo. Should be
Class 2: X = C+, Z = C (class GPA = 2.15)
The point is that the lower the student quality, the higher the class GPA.
The only way to really avoid this sort of thing is to have nation-wide exams graded by people who don’t know the students. This is the case in some places.
I believe this effect is a version of
http://en.wikipedia.org/wiki/Simpson's_paradox
Interesting. I’d never heard of Simpson’s Paradox.
Incidentally, when I said that my intuition might have led me to believe this was impossible, what I meant was that I might have thought it was impossible to get a perfect reversal of the order. It’s not at all surprising to me that you can get effects generally like this, where one clump of people who should come out low come out high and vice versa, but I think that I would have guessed that there’d always be at least some pairs who came out in the correct order.
(Since I wasn’t asked the question before seeing the answer, I’m not sure that this is what I would actually have thought.)