Gap Analysis Program (GAP) Protected Areas and Land Cover Data Viewer

This geographic website is for the Gap Analysis Program (GAP) Viewer of the USGS for Protected Areas and Land Cover Data.

Separated into two different viewers for user clarity, the viewers provide users ranging from the public to professional land managers a spatially explicit inventory of the Protected Areas of the United States and a consistent nation-wide inventory of vegetation and land-use patterns for the United States.

This compilation of data types for the Gap Analysis Program is being served by the United States Geological Survey for aid in conservation, land management, planning, and recreation, amongst other uses.  In order to increase collective knowledge, these interactive maps are designed to disseminate up to date, concise, and specific data to facilitate the planning and management of biological diversity on a local, regional, and national scale.

Data viewers like these can be exceptionally helpful to both grab data and see data without the need to use any local semblance of a Geographical Information System.  In accordance with our national park projects and our final projects, I could see these viewers becoming exceedingly helpful in data gathering and analysis.  I encourage you to check them out and see how you can utilize them!

PAD: https://maps.usgs.gov/padus/

LCD: https://maps.usgs.gov/padus/

Brilliantmaps: Making Sense Of The World, One Map At A Time

Have you every thought about how many times Scotland’s population could fit inside England, or wondered how many countries have been affected by the current ‘Panama Papers’ scandal, or maybe imagined how the world would look in Harry Potter’s eyes? Maybe? O.k. maybe you’re not that curious…. But we have all scoured the internet to find the perfect map to explain a certain phenomena in our research papers and powerpoint presentations. Well…Brilliantmaps is here for you! Brilliantmaps is the holy grail of maps!

Even if you are not obsessed with cartography, Brilliantmaps has something for everyone. The site regularly updates its content with interactive maps covering everything from current developments such as the Syrian Refugee Crisis to classic maps showing European’s view of the world in the beginning of the colonial era. For the true map lovers out there, the site ups the ante, allowing users to use scratch map templates to create their own maps and showcase it to the world. There is also a list of recommended board games that breathe a breath of fresh air into map making. Have a mentioned the Facebook page? And the newsletter? Brilliantmaps is brilliant because it provides a framework for integrating maps into our everyday life.

Check out some of my favorite maps below and don’t forget to take a look at the thousands of maps available on the website: http://brilliantmaps.com/

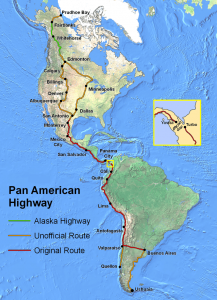
The Pan American Highway

PanAmericanHwy

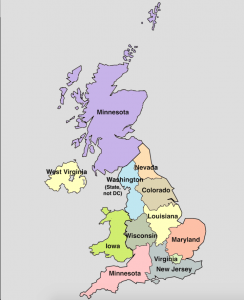
UK regions compared to US States

UK-regions-compared-to-US-States

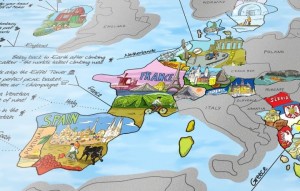
The Travel Bucket List

Bucket-List-World-Map-Scratch-Edition

Go get your map on! You will be surprised at the power of mapping!

Cheers.

Javanni.


Breathing Earth

Need a quick summary of how our earth is changing? Do you like strange background music and outdated websites? If so, Breathing Earth is for you!

Check it out: http://www.breathingearth.net/

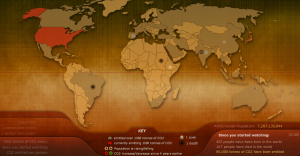
Breathing Earth is a simulation of real-time changes to earth’s carbon dioxide emissions and human population.  While there are many interactive websites that show facts and statistical information about carbon dioxide emissions, this website makes understanding the intensity of our CO2 outputs more relatable.  Instead of counting outputs per year, outputs are measured in real time.  While there are facts regarding specific county’s emissions and populations, the first numbers the websites show are for the entire planet.  This is important because, as they mention in the text below the map, emissions are a global issue: emissions do not just effect their country of origin.

Breathing Earth is significant to our course because it illustrates some of the anthropogenic alterations to the planet’s atmosphere.

Screen Shot 2015-04-22 at 8.28.27 PM


It’s obvious that this page has not been updated for a while (although it’s been copyrighted through 2015).  While the website creators mention that approximations may be too low, I am not surprised as their population data is five years old and their emissions data is NINE years old.  It would be interesting for them to alter their data to see how much faster our population and emissions are increasing (or perhaps decreasing, depending upon the country?).

Overall, I’d say the concept of this website is great: it’s simple and easy to understand, yet still gets the point across.   However, if you’re looking for an interactive, up to date map with some more detail, I would suggest http://www.globalcarbonatlas.org/?q=en/emissions (See Dan’s post below!).

Do you think it’s worth keeping simple maps like this when there are complex, interactive maps that have more info?

-Olivia

Exploring the Ocean Floor with Nautilus Live

In our modern world of of GPS, when it seems like there is no frontier left, the ocean floor remains largely unexplored and unmapped. This website, hosted by National Geographic, follows the crew and scientists aboard the Nautilus. The crewmembers’ most recent mission was from June to November 2013 to explore the Gulf of Mexico and the Caribbean, mapping geological, biological, archaeological and chemical aspects of these areas to depths of about 2000 meters. Highlights of the trip included new discoveries of shipwrecks.

The beauty of this website is that it allows the general public- elementary school students, college professors and scientists, and average curious people- to connect with the crew. The website includes pictures from the missions, including this one of the bow of a shipwreck.

Additionally, the site provides videos of the ship’s robots, Hercules and Argus, at work, collecting samples thousands of feet below the surface. This is an image of Hercules using a temperature probe to test an underwater volcano:

The most interesting part of this website is that during missions, it connects directly to the crew aboard the ship. It shows a live video feed of the ship’s activities and allows students and the public to chat live with the Nautilus’s educators, who respond on an audio feed to students’ typed questions.

Finally, the site includes helpful links for teachers and kids, including interactive mapping and robotic design games to encourage and inspire future geographers to explore the ocean frontier.

http://www.nautiluslive.org/

James River Report Card 2011

In doing research on the James River in conjunction with our lab and class discussion, I came upon an interesting and relevant report on the current state of the James River. The pdf attached here shows a detailed account of how the James River is doing today, in comparison with recent years and the history since environmental records have been recorded.

The report gives the current state of the river a C overall, a score lower than I anticipated. After our walk around Belle Isle, it seemed like the James was in pretty good shape, but the evidence shows there is significant room for improvement in some areas. In terms of wildlife, the report card confirms that the population of small-mouthed bass has improved, but is still only at about half of the population goal. Another successful area of wildlife in the river system is the bald eagle, which has reached its goal for a healthy population.

The river scored a B- in Habitat, its highest scoring section. While the river has seen improvements overall in the long term, in the short term it is obvious that it still struggles from too many nutrients and sediments, which is leading to abundant algae and poor water clarity. Richmond needs to invest more money in the protection of runoff in order to improve the score for this section.

With regard to pollution and plans for restoration, the river scored a C in both categories. The levels of nitrogen and sediments in the river are still unsustainably high. The city works to protect the area of the river and improve the riparian zones around the river, but more needs to be done in order to bring the James River to the set level of cleanliness.

Questions to think about:

What is a realistic goal for improvement in the river for next year? Which area of the river should Richmond focus on improving? How could efforts be increased? How could awareness in the community and surrounding areas be increased?

Check out the report card here! State of the James River 2011

Source: http://www.jamesriverassociation.org/the-james-river/state-of-the-james/