Save the Sound

Save the Sound is a website dedicated to the waters of the Long Island Sound in New York and Connecticut. The Sound is an estuary ecosystem with a watershed that extends more that 16,800 square miles into Canada. However, the waters of the Sound face constant pressures from human activity throughout New England and Eastern New York. Save the Sound has been dedicated to the restoration, protection and preservation of the sound for over 40 years. The organization have programs dedicated to stopping pollution, restoring fisheries and habitats, defending drinking water and protecting the climate and air. Every year they have coastal cleanups that engage thousands of citizens to clean up marine debris. Save the Sound is a huge promoter of citizen scientists to monitor water quality and help them with their clean up efforts. Save the Sound encourages individuals who live around the Sound to become members or volunteer to the organization. They also work with schools and other organizations to create fundraisers and organize beach cleanups and educate people about how to help restore the Long Island Sound. Currently, they are working on a project to conserve Plum Island, an island that is the largest site for sea-gulls in New York and a habitat for 220 different bird species. In a 2009 act of Congress the Federal Government decided to put Plum Island up for auction. Save the Sound has gathered over 100 organizations to file a federal lawsuit and stop the sale of the island. Save the Sound is an organization that encourages people who leave near the Sound and use its resources on a daily basis to fight for their land and help restore it. Check out their website to learn about all of the initiatives they have in place to restore and save the Long Island Sound!

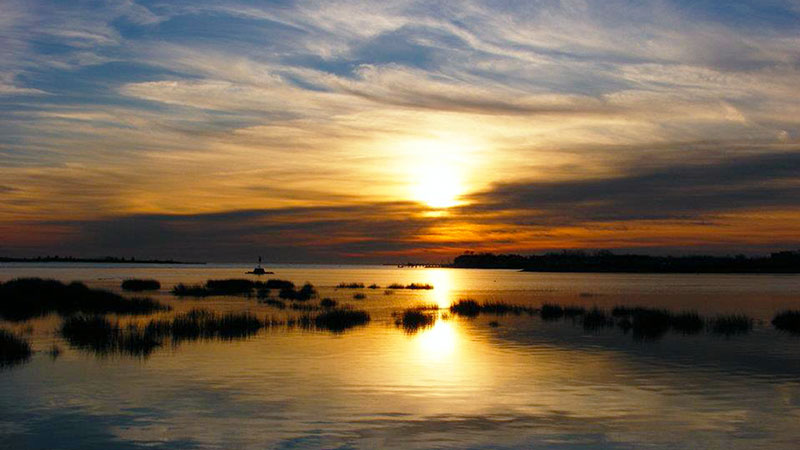
Image by Save the Sound

The Ocean Cleanup – The Largest Cleanup in History

The Ocean Cleanup is an environmental engineering organization that has been designing cutting edge technology for cleaning up the planet’s oceans. Led by 24-year old CEO Boyan Slat, the company has ambitiously focused its efforts on cleaning up the Great Pacific Garbage Patch, a collection of plastic and garbage covering 1.6 million km between Hawaii and California. It is the largest collection of ocean garbage in the world. The Ocean Cleanup is in the process of scaling up their prototype system in the North Sea to prepare it for use in the Pacific Ocean. Once perfected, the system will have the ability to collect trash from the ocean surface and a few feet under water, where garbage ships can come along and pick it up (check out the system in the picture below). At full capacity, the system will be able to remove 50% of the plastic in the Great Pacific Garbage Patch every five years. The website contains information and videos that are extremely helpful in understanding the technological development process and current stage that the company is at in getting the system fully operational. The cool thing about the website is that with the technology it displays being so revolutionary, the site truly allows you to see history unfolding before your eyes! You become a spectator of how an innovative group of people is making an impact in restoring our planet’s oceans closer to their natural state.

NOAA Interactive Natural Hazards Map

The National Oceanic and Atmospheric Administration (NOAA) has an interactive map called the Natural Hazards Viewer. This map contains data on both recent and historic significant natural disasters. The dataset includes tsunami events, tsunami observations, significant earthquakes, significant volcanic eruptions, volcanoes, Deep-Ocean Assessment and Reporting of Tsunamis (DART) Deployments, plate boundaries, tsunami times, and selected significant tsunami events. When browsing the user can select which type of hazard they would like to see information on, and then the user can select different data points detailing these events.  There is a wide range of information available between points, some simply contain the date, location, and type of event, while others contain information on the fatalities, social and economic impacts, and information on the individual witnesses, and the events leading up to the natural disaster.

NOAA’s Natural Hazards Viewer compiles a large quantity of information natural disasters onto an easy to navigate and interactive interface. They get their data from the National Geophysical Data Center, which records data on earthquakes, tsunamis, and volcanic eruptions, in order to support research, planning, and mitigation efforts.  I thought this was a really interesting use of GIS in order to create a map that not only compiles all the spatial data, but contains all the social and economic data as well. I would definitely recommend everyone play around with this website at some point, it is a really fascinating, freely available resource!

https://maps.ngdc.noaa.gov/viewers/hazards/

NOAA Marine Protected Areas Network

Have you ever wanted to learn more about marine protected areas (MPAs) in the United States? Look no further than the National Oceanic and Atmospheric Administration’s (NOAA) website completely devoted to MPAs.

The about section defines MPA as “a broad term for a park or other protected area that includes some marine or Great Lakes area” and gives information on the classification system used for MPAs that describes MPAs in functional terms using five characteristics common to most MPAs: 1) conservation focus; 2) level of protection; 3) permanence of protection; 4) constancy of protection; and 5) ecological scale of protection. MPAs are important for conservation of oceanic ecosystems and can be found all around the country and world. The website contains numerous informational sections and content for viewers of all ages and levels of knowledge on MPAs. One feature is an interactive MPA Date Viewer that allows visitors to click on any of the 1600 MPAs in US waters  on a map that have been compiled in a database by NOAA’s Marine Protected Areas Center on a map and view information on them.

Example of MPA Data Viewer in use

NOAA also provides an extensive management section, which contains a section on Ocean Use Data with pdf documents on regional ocean use data, which are slightly dated, ranging from 2015 to 2010.  For example, the most recent is the Pacific Regional Ocean Uses Atlas, which was designed to document a full range of human activities and sectors in the ocean to support offshore renewable energy planning in the Bureau of Ocean Energy Management’s Pacific region. Along with the pdf document GIS data is also provided. One part of this page I found interesting was their participatory ocean use mapping process, used to gather ocean use data by engaging local and regional ocean experts through interactive mapping. This allows NOAA to more effectively collect data on MPAs while engaging a wide range of people that use these MPAs on a daily basis. Along with this, the website contains numerous informational pdfs on a wide variety of topics and studies involving MPAs. For further reading and an example, the informational pdf “Marine Protected Areas Building Resilience To Climate Change Impacts” can be found here.

Another great section of their website is the Experiencing MPAs section, which is meant for all visitors. The page greets visitors by saying “The best way to understand and enjoy our nation’s diverse MPAs is to visit. But for now, you can dive in from wherever you are to our MPA viewer, multimedia page, blog and more.” The page provides links to the subsections MPA Viewer, Multimedia, Marine Protected Areas Blog, and What Can You Do. The multimedia section contains numerous phots and videos of MPAs as well as podcasts produced by the National Ocean Service. My favorite part of this is Earth Is Blue, a blog where NOAA’s Office of National Marine Sanctuaries posts a photo each day and a video each week highlighting the wonder and beauty of marine sanctuaries and MPAs and the work they do to protect them.

I have only just barely scratched the surface of all this website has to offer. Be sure to give it a look!


National Geographic Encyclopedic Entries

The National Geographic encyclopedic entries page is a really useful tool for our Physical geography class since it provides various entries on class related concepts like hot spots, El Nino, earth’s crusts, continental drift, etc. It’s really easy to use, you can either enter the topic you are interested in looking for or just scroll down the pages looking for it. Each entry provides a set of images, definitions, animations, videos, background information, related material and even useful sources that connect to other articles about the subject.  There’s even a complete vocabulary tap that expands on explaining each key term’s definition and use. This would be a really useful tool to study for our final exam since you can search in a more interactive way concepts that you feel you need to look up more information about.

https://www.nationalgeographic.org/encyclopedia/

Smithsonian Ocean Portal

This website, the Smithsonian Ocean Portal, is an educational website aimed to inform about the oceans. They offer a variety of resources and tabs, such as tabs on ocean life and ecosystems, planet ocean, the ocean through time, conservation, and human connections. Each tab also narrows to specific ocean species or categories, such as mammals or reptiles. The website stays up to date with blog posts and a newsroom that gives reviews of articles.

http://ocean.si.edu

One article talks about how the loss of ice in the Arctic effects species that rely on the ice to survive. One example of a species is a harp seal, which uses the ice for nursing and feeding its yearlings. Global warming and the melting of sea ice puts these seals and yearlings in danger of hypothermia, starvation, and crushed by moving ice in the Arctic. We often think about how global warming will effect us and the environments we live in, but its important to think about how it will effect other species and their genetic diversity.

Is Dry Farming the Next Wave in a Drought-Plagued World?

Dry farming is a tactic in which plants are only watered in the seedling stage and then left to the whims of nature. There is no irrigation and no rain. The plants instead must rely on their roots to bore deep into the ground and find remaining water from the past seasons. Dry farmed plants will often look dead and wilted, but their fruit can still be successful. Tomato plants were grown in California using this method. The vines of the plant were withered and brown, but the tomatoes still managed to come in full and red. This farming method relies on the plants ability to survive by finding its own supplies of water. The tomatoes grown for dry farming are closest to wild species of tomatoes. They are selected for their hardiness, but the fruit they bear is as flavorful as any other. Dry farming may serve as a key in meeting food demands during times of drought, like modern day California. This method is also important because it can help serve us in the future when climate change causes increased levels of drought.

SNOWcast through interactive maps

Link: http://www.intellicast.com/Travel/Weather/Snow/SNOWcast.aspx

With much technology advancement, contemporary society demands more accurate weather forecasts. Of all the possible factors for weather forecast, snow forecast is one of the more important weather forecast. This is because now can have detrimental effect on transportation, outdoor activity, etc. Due to the wrong snow forecast, the Fairfax County Public School in Virginia experienced a detrimental effect of having tens of accidents around the schools. Likewise, accurate snow forecast will really help plan to prevent any devastating situation. The intellicast projects different forecasts with maps that are represented at a different angle of the weathers. For snow, it has the delay risk, travel outlook, roadway conditions, snow cover, SNOWcast, 48hr snow, 24hr snow, and many more to inform the public about the possible hazard. Such maps allow the people to easily see and accurately interpret the weather forecast. These information will further help to prevent possible hazard.

How Wildlife May Fare Under Trump

Link to the article: http://news.nationalgeographic.com/2016/11/wildlife-watch-trump-wildlife-trafficking-animal-conservation/

Since the recent presidency elections one of the major questions was about, what would Trump do for the environment? If he becomes the president-elect. The debates in this presidency election surround various of concerns, including some which focus on national security, trade, economics, and to a lesser degree in this election cycle, on the environment. Wildlife, however, plays a part in all those concerns.

“Given our demonstrably disastrous effects on wildlife, there is now recognition that humans have a certain obligation to protect wildlife for its own sake” (Rachel, Jani, 2016). Since 2013 president-elect Obama has worked greatly on the conservation and sustainability of nature and protection of wildlife besides that we even worked on reduction of the pollutants which effects the earth and its climate. Which shows the attempt by the president to really protect the environment for a better and sustainable future.

However, the concern now rises what is the new president-elect going to do for the environment, as some of his campaigns seemed to promote the idea of climate change being a hoax rather a real problem which deserves concern. Trump’s administration seems to promote trophy hunting and other unfriendly- environmental amendments which, may cause a disruption through out the ecosystem, especially the hydrosphere, atmosphere, and biosphere. Besides, the wall which Trump plans to build is going to disrupt the ecosystem especially the biosphere as its going to hinder animal migration which might end up being a cause for the extinction of these animals.

Syracuse University Hydrosphere Research Group

The purpose of the Syracuse University Hydrosphere Research Group is to integrate research in the Hydrosphere and physical geography as a whole into departments and colleges throughout Syracuse University. The group played a crucial role in creating the Interdisciplinary Graduate Education, Research, and Training (IGERT) proposal, which developed an integrated undergraduate training program focused on human interactions with the hydrosphere. The group has also taken steps within the earth sciences department to improve the quality of the water program. They are constantly bringing in new faculty and equipment to allow for more water related research in the hydrosphere.

On the group’s website, information on faculty members involved in the group and their contact information is provided. Visitors to the website are also able to investigate subgroups of the project including SWIFT, Water Science & Engineering, and hydrology, among others. Finally, there is a tab on the website that discusses job positions available to become a faculty member of the Syracuse University Hydrosphere Research Group, and how to apply.

http://hydrosphere.syr.edu