Update: The New York Times has a short piece about the data release. Like me, they emphasize the increased precision of estimates of cosmological parameters such as the age of the Universe, and don’t cite any surprises in the data.
The WMAP five-year data have been released. The WMAP maps of the microwave background radiation are one of the most important sets of data in cosmology. A lot of what we know about dark matter, dark energy, the expansion rate of the Universe, inflation, and things like that come from this data set. In a quick glance at the abstracts of the papers and at the tables of parameters, I don’t see any big surprises: the error bars on parameters have gotten smaller, but nothing has radically changed. That’s pretty much what one would expect, of course.
It’ll take a while to chew through all of the results, so maybe there are big surprises that I didn’t notice.
The smallness of the errors on a lot of the parameters are amazing. To take just one example, the Hubble constant (that is, the expansion rate of the Universe) is 72 +/- 3 km/(s Mpc) according to this data. Cosmologists have been trying to measure this number for nearly a century, and as recently as the 1990s, it was uncertain by nearly a factor of 2. Now we know it (and a bunch of other things) with uncertainties of only a few percent.
Here’s the temperature power spectrum from the new data, along with some other experiments. (All plots in this post are from this paper.)
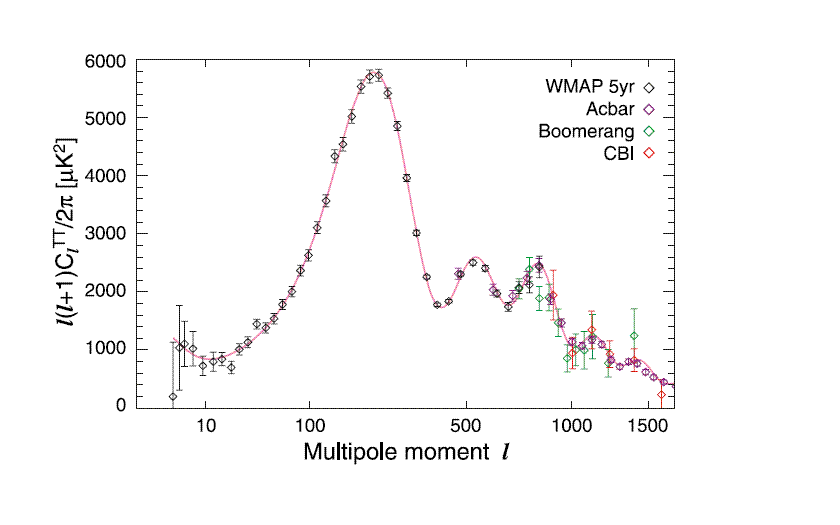
It continues to amaze me how well the data match theoretical predictions.
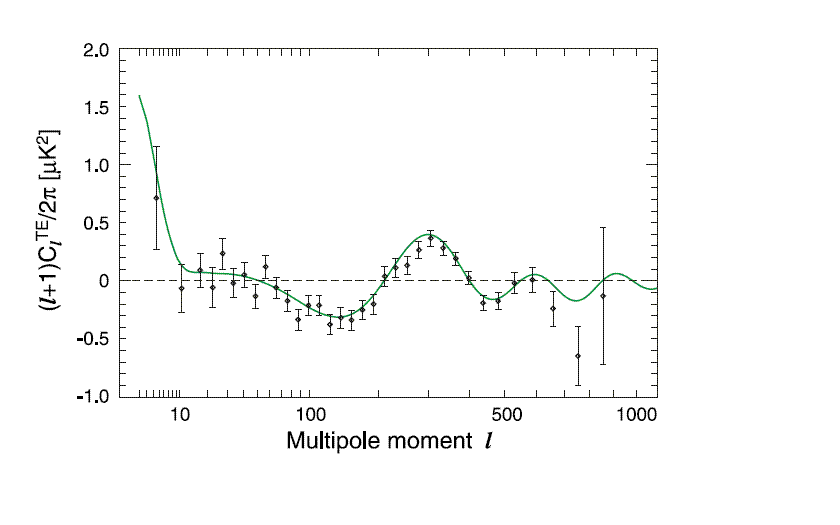
The next frontier in the microwave background is measurements of the polarization, which is a much harder prospect. The easiest thing to measure about polarization is its cross-correlation with temperature, and WMAP has nailed that very well:
But the community is hoping to do better than that. The next challenge is to measure the polarization directly, without cross-correlating with the temperature. WMAP and other experiments have done that, but still with very large error bars:
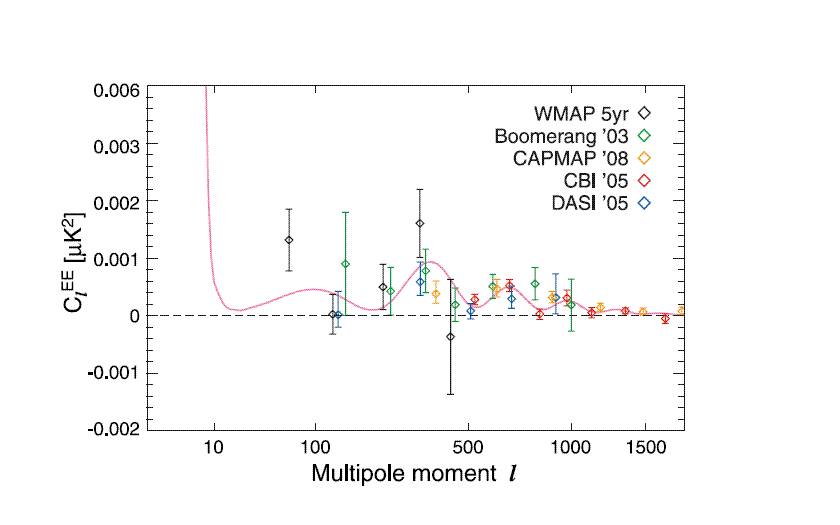
But even that’s not the whole story. This data shows the E component of the polarization, but there’s another polarization signal called the B component, which is an order of magnitude or more smaller. That component is predicted to contain information about inflation that’s hard to get any other way, so a bunch of people are trying to figure out whether it can be measured. The MBI experiment I’m working on is a technology pathfinder for this effort. Looking at how hard WMAP had to work to get any information at all about the larger E signal, you can see that we have our work cut out for us!
is there any one who knows any source about this subject in other languages?