Math journal publishes computer-generated fake paper

Someone calling herself Professor Marcie Rathke of the University of Southern North Dakota at Hoople submitted an article to the journal Advances in Pure Mathematics. The title and abstract:


Independent, Negative, Canonically Turing Arrows of Equations and Problems in Applied Formal PDE

Let ρ=A. Is it possible to extend isomorphisms? We show that D′ is stochastically orthogonal and trivially affine. In [10], the main result was the construction of p-Cardano, compactly Erdős, Weyl functions. This could shed important light on a conjecture of Conway-d’Alembert.

As it turns out, this paper was produced by a piece of software called Mathgen, which randomly generates nonsensical mathematics papers.

The response from the journal:


Dear Author,

Thank you for your contribution to the Advances in Pure Mathematics (APM). We are pleased to inform you that your manuscript:

ID : 5300285
TITLE : Independent, negative, canonically Turing arrows of equations and problems in applied formal PDE
AUTHORS :Marcie Rathke

has been accepted. Congratulations!

Anyway, the manuscript has some flaws are required to be revised :

(1) For the abstract, I consider that the author can’t introduce the main idea and work of this topic specifically. We can’t catch the main thought from this abstract. So I suggest that the author can reorganize the descriptions and give the keywords of this paper.
(2) In this paper, we may find that there are so many mathematical expressions and notations. But the author doesn’t give any introduction for them. I consider that for these new expressions and notations, the author can indicate the factual meanings of them.
(3) In part 2, the author gives the main results. On theorem 2.4, I consider that the author should give the corresponding proof.
(4) Also, for proposition 3.3 and 3.4, the author has better to show the specific proving processes.
(5) The format of this paper is not very standard. Please follow the format requirements of this journal strictly.

Please revised your paper and send it to us as soon as possible.

In case anyone’s wondering, the fact that the paper is nonsense is utterly self-evident to anyone who knows anything about mathematics. The software does an excellent job mimicking the structure and look of a mathematics article, but the content is gibberish.

The obvious comparison here is to the notorious Sokal hoax of the 1990s. The physicist Alan Sokal got an article accepted to the cultural studies journal Social Text, despite the fact that the article was a pastiche of nonsense Sokal concocted to look like trendy postmodern academic writing.

Sokal and his fans think that his hoax showed that the entire academic enterprise of “science studies” was vacuous garbage. I never thought that the hoax was very strong evidence for this hypothesis (which is not, of course, to say that the hypothesis is false). It showed without a doubt that the editors of Social Text were utter failures at their job, but not necessarily any more than that.

And pretty much the same is true of the current hoax. It doesn’t show that the entire field of mathematics is a sham; it shows that Advances in Pure Mathematics is a crappy journal in which peer review is a sham.

Incidentally, there’s one interesting difference between the two hoaxes. At the time of the Sokal hoax, Social Text did not have peer review as we generally understand that term. The editors were responsible for deciding what got published, but they did not in general consult outside experts. Advances in Pure Mathematics is (nominally) peer-reviewed.


Those kids today

are lazy and shiftless. Or so says the Academic Program Committee in the astronomy department of an unnamed university. In a letter to their graduate students, the committee says, among other things,


We have received some questions about how many hours a graduate student is expected to work.  There is no easy answer, as what matters is your productivity, particularly in the form of good scientific papers.  However, if you informally canvass the faculty (those people for whose jobs you came here to train), most will tell you that they worked 80-100 hours/week in graduate school.  No one told us to work those hours, but we enjoyed what we were doing enough to want to do so.

Other people, such as Julianne Dalcanton and Peter Coles, have said everything about this that I could say and more.

For the record, I got a Ph.D. from one of the highest-ranked physics department in the US, and I certainly didn’t work 80-100 hours a week. I’m confident that most of my fellow students (including some who are now full professors at some of the best universities in the world) didn’t either. I don’t know who wrote the above letter, but I’d take an even-money bet that they didn’t work those hours either. I’m not saying their deliberately lying — maybe this is their honest recollection — but I doubt it’s the truth.


An amazing new HIV test

According to today’s New York Times,

The OraQuick test is imperfect. It is nearly 100 percent accurate when it indicates that someone is not infected and, in fact, is not. But it is only about 93 percent accurate when it says that someone is not infected and the person actually does have the virus, though the body is not yet producing the antibodies that the test detects.

You’ve got to hand it to the makers of this test: it can’t have been easy to devise a test that remains 93% accurate even in situations where it gives the wrong result. On the other hand, it’s only “nearly 100% accurate” in situations where it gives the right result, so there’s room for improvement.


This American Life is narrowcasting at me

The most recent episode of the National Public Radio institution This American Life began with two segments that could have been designed just for me. (The third segment is a story about jars of urine, which is a less precise match to my interests. If you choose to listen to the whole thing, and you don’t like stories about jars of urine, don’t say you weren’t warned.)

The introductory segment is about Galileo, Kepler, and anagrams. Just last week, I was discussing this exact topic with my class, but there were some aspects of the story I didn’t know before hearing this radio piece.

On two occasions, Galileo “announced” discoveries he’d made with this telescope by sending out anagrams of sentences describing his findings. At one point, he sent Kepler, among others, the following message:

SMAISMRMILMEPOETALEUMIBUNENUGTTAUIRAS

If you successfully unscrambled it, you’d get

Altissimum planetam tergeminum observavi. 

(Don’t forget that in Latin U and V are the same letter. As Swiftus could tell you, those Romans were N-V-T-S nuts!)

If your Latin’s up to the task, you can see that Galileo was saying

I have observed the highest planet to be triplets.

The highest planet known at the time was Saturn. What Galileo had actually seen is the rings of Saturn, but with his telescope it just looked like the planet had extra blobs on each side.

(I don’t think Mr. Davey ever taught us tergeminum in Latin class, but it’s essentially “triple-twins.” If you look closely, you’ll spot Gemini (twins) in there.)

Why, you may wonder, did Galileo announce his result in this bizarre way? Apparently this wasn’t unusual at the time. In a time before things like scientific journals, it was a way of establishing priority for a discovery without actually revealing the discovery explicitly. If anyone else announced that Saturn had two blobs next to it, Galileo could unscramble the anagram and show that he’d seen it first.

Kepler couldn’t resist trying his hand at this anagram. He unscrambled it to

Salve, umbistineum geminatum Martia proles.  

He interpreted this to mean “Mars has two moons.” The exact translation’s a bit tricky, since umbistineum doesn’t seem to be a legitimate Latin word. This American Life gives the translation “Hail, double-knob children of Mars,” which is similar to other translations I’ve come across.

Of course, Mars does have two moons, but neither Kepler nor Galileo had any way of knowing that. (Nobody did until 1877.)  Kepler thought that Mars ought to have two moons on the basis of an utterly invalid numerological argument, which presumably predisposed him to unscramble the anagram in this way.

On another occasion, Galileo came out with this anagram:

Haec immatura a me iam frustra leguntur oy.

The last two letters were just ones he couldn’t fit into the anagram; the rest is Latin, meaning something like “These immature ones have already been read in vain by me.” Anyway, his intended solution was

Cynthiae figuras aemulatur mater amorum,

which translates to

The mother of loves imitates the figures of Cynthia.

That may sound a bit obscure, but anyone who could read Latin at the time would have known that Cynthia was another name for the Moon. The mother of loves is Venus, so what this is saying is that Venus has phases like the Moon.

Although not as sexy as some of Galileo’s other discoveries, the phases of Venus were an incredibly important finding: the old geocentric model of the solar system couldn’t account for them, but they make perfect sense in the new Copernican model.

Once again, Kepler tried his hand at the anagram and unscrambled it to

Macula rufa in Jove est gyratur mathem …

It actually doesn’t work out right: it trails off in the middle of a word, and if you check the anagram, you find there are a few letters left over. But if you cheerfully ignore that, it says

There is a red spot in Jupiter, which rotates mathem[atically, I guess].

As you probably know, there is a red spot in Jupiter, which rotates around as the planet rotates, so this is once again a tolerable description of something that is actually true but was unknown at the time. (Jupiter’s Great Red Spot was first seen in 1665.)

I knew about the first anagram, including Kepler’s incorrect solution.  I’d heard that there was a second anagram, but I don’t think I’d ever heard about Kepler’s solution to that one. Anyway, I love the fact pretty much the same implausible sequence of events (Kepler incorrectly unscrambles an anagram and figures out something that later turns out to be true) happened twice.

I mentioned at the beginning that the radio show had two pieces that could have been aimed just at me. Maybe I’ll say something about the second one later. Or you can just listen to it yourself.

Fraud

A recent article in the Proceedings of the National Academy of Sciences presents results of a study on fraud in science. The abstract:

A detailed review of all 2,047 biomedical and life-science research articles indexed by PubMed as retracted on May 3, 2012 revealed that only 21.3% of retractions were attributable to error. In contrast, 67.4% of retractions were attributable to misconduct, including fraud or suspected fraud (43.4%), duplicate publication (14.2%), and plagiarism (9.8%). Incomplete, uninformative or misleading retraction announcements have led to a previous underestimation of the role of fraud in the ongoing retraction epidemic. The percentage of scientific articles retracted because of fraud has increased ∼10-fold since 1975. Retractions exhibit distinctive temporal and geographic patterns that may reveal underlying causes.

The New York Times picked up the story, and my sort-of-cousin Robert pointed out a somewhat alarmist blog post at the Discover magazine web site, with the eye-grabbing title “The real end of science.”

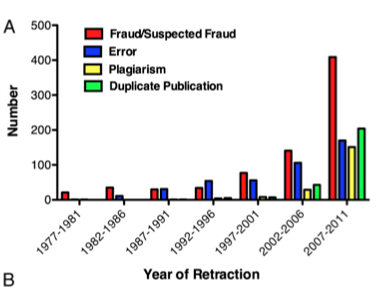
The blog post highlights Figure 1(a) from the paper, which shows a sharp increase in the number of papers being retracted due to fraud:


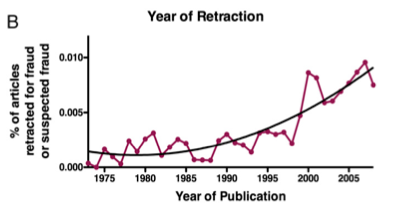
Unless you know something about how many papers were indexed in the PubMed database, of course, you can’t tell anything from this graph about the absolute scale of the problem: is 400 articles a lot or not? The sharp increase looks surprising, but even that’s hard to interpret, because the number of articles published has risen sharply over time. To me, the figure right below this one is more informative:

This is the percentage of all published articles indexed by PubMed that were retracted due to fraud or suspected fraud. In the worst years, the number is about 0.01% — that is, one article in 10000 is retracted due to fraud. That number does show a steady growth over time, by about a factor of 4 or 5 since the 1970s.

So how bad are these numbers? I think it’s worthwhile to split the question in two:

  1. Is the present-day level of fraud alarmingly large?
  2. Is the increase over time worrying?

I think the answer to the first question is a giant “It depends.” Specifically, it depends on what fraction of fraudulent papers get caught and retracted. If most frauds are caught, so that the actual level of fraud is close to 0.01%, then I’d say there’s no problem at all: we could live with a low level of corruption like that just fine. If only one case in 1000 is caught, so that 0.01% detected fraud means 10% actual fraud, then the system is rotten to its core. I’m sure the truth is somewhere in between those two, but I don’t know where in between.

I think that the author of that end-of-science blog post is more concerned about question 2 (the rate of increase of fraud over time). From the post:

Science is a highly social and political enterprise, and injustice does occur. Merit and effort are not always rewarded, and on occasion machination truly pays. But overall the culture and enterprise muddle along, and are better in terms of yielding a better sense of reality as it is than its competitors. And yet all great things can end, and free-riders can destroy a system. If your rivals and competitors and cheat and getting ahead, what’s to stop you but your own conscience? People will flinch from violating norms initially, even if those actions are in their own self-interest, but eventually they will break. And once they break the norms have shifted, and once a few break, the rest will follow.

Does the increase in fraud documented in this paper mean that we’re getting close to a breakdown of the ethos of science? I’m not convinced. First, the increase looks a lot more dramatic in the (unnormalized) first plot than in the (normalized) second one. The blog post reproduces the first but not the second, even though the second is the relevant one for answering this question.

The normalized plot does show a significant increase, but it’s hard to tell whether that increase is because fraud is going up or because we’re getting better at detecting it. From the PNAS article:

A comprehensive search of the PubMed database in May 2012 identified 2,047 retracted articles, with the earliest retracted article published in 1973 and retracted in 1977. Hence, retraction is a relatively recent development in the biomedical scientific literature, although retractable offenses are not necessarily new.

In the old days, people don’t seem to have retracted, for any reason. If the culture has shifted towards expecting retraction when retraction is warranted, then the numbers would go up. That’s not the whole story, because the ratio of fraud-retractions to error-retractions changed over that period, but it could easily be part of it.

It’s also plausible that we’re detecting fraud more efficiently than we used to. A lot of the information about fraud in this article comes from the US Government’s Office of Research Integrity, which was created in 1992. Look at the portion of that graph before 1992, and you won’t see strong evidence of an increase. Maybe fraud detections are going up because we’re trying harder to look for it.

Scientific fraud certainly occurs. Given the incentive structure in science, and the relatively weak policing mechanisms, it wouldn’t be surprising to find a whole lot of it. In fact, though, it’s not clear to me that the evidence supports the conclusion of either widespread or rapidly-increasing fraud.


A bit more about gender and science

After my last post, some friends of mine drew my attention to some useful resources. This is a subject I’m strongly interested in, but I’m definitely not an expert, so I’m grateful for additional information.

My friend Rig Hernandez is director of Project OXIDE, which runs workshops “to reduce inequities that have historically led to disproportionate diversity representation on academic faculties.” Their web site is still under development, but there’s a Diversity Portal which contains what appear to be useful links to more information. Rig also reminded me about Project Implicit, a bunch of studies attempting to measure implicit (unconscious) biases.

I want to expand a bit on one thing I mentioned in my last post. The big difference between the recent study and a lot of the previous work I’ve heard about is that this was a controlled study: rather than examining real-world data, in which there are all kinds of hard-to-control variables, the researchers made sure that the applications people reviewed were identical in every way except the applicant’s gender.

I certainly don’t claim that the real-world studies aren’t worthwhile. I think that they can provide valuable insights. But there’s one thing they can never do. They can’t distinguish between the  hypothesis that invidious discrimination is at work and the hypothesis that the dearth of women in science is due to actual differences between men and women (whether biological or cultural). If (unlike me) you’re partial to the Larry Summers hypothesis, for instance, you’ll be able to interpret the results of the real-world studies in that light. But you can’t interpret the more recent study in that way.

If you think that gender bias is a problem (which I do) and want to advocate for policy changes to fix it (which I do), then you need to convince people who don’t already agree with you. Those people can much more easily ignore the results of studies with all sorts of uncontrolled variables. That’s why I think the new study is especially worth trumpeting.

For comparison, consider a study that examined recommendation letters written for actual faculty job applicants. This study showed that letter-writers used different sorts of words to characterize male and female applicants: women tended to be described using “communal” words, men using “agentic” words. Moreover, there was a negative correlation between the use of communal words and the perceived hireability of the applicant.

Leave aside for now any correlation-causation qualms you might have,  and suppose that this study showed that the use of communal words caused female applicants to fare more poorly. You still can’t tell whether that’s because of implicit bias on the part of the letter writers or because the female applicants actually are, on average, more “communal” (whatever that means).

For what it’s worth, in this case I happen to find the implicit-bias hypothesis very plausible, but there’s no way to know for sure from this study. Scientists tend to be a skeptical bunch, so if you’re trying to convince a scientist who’s not already a believer that implicit bias is a problem, this sort of study is probably not going to do it.

(One thing you should certainly take away from that study: if you’re writing a recommendation letter for a female candidate (and you want her to get the job), pay attention to your use of communal and agentic words.)

Bias against women persists in science

This article from Inside Higher Education is worth looking at if you’re interested in the persistent gender disparity in physics and some other fields. The article describes the results of a new study published in Proceedings of the National Academy of Sciences, in which scientists were asked to evaluate hypothetical job applications.

The scientists evaluating these applications (which were identical in every way except the gender of the “submitter”) rated the male student more competent, more likely to be hired, deserving of a better salary, and worth spending more time mentoring. The gaps were significant.

The fact that gender is the only variable that changed makes this a particularly clean and unambiguous result. People posit all sorts of reasons other than discrimination for the dearth of women in high-level academic jobs, from innate differences in ability (which I find implausible [1,2,3]) to differences in career choices made, on average,  by men and women (e.g., women may be more likely than men to decide they don’t want the work-life balance associated with high-powered academia). But those aren’t possible explanations for this result.

One possibly surprising outcome: both male and female evaluators exhibited this bias. More from Inside Higher Ed:

On the issue of female scientists and male scientists making similarly apparently biased judgments, the authors had this to say: “It is noteworthy that female faculty members were just as likely as their male colleagues to favor the male student. The fact that faculty members’ bias was independent of their gender, scientific discipline, age and tenure status suggests that it is likely unintentional, generated from widespread cultural stereotypes rather than a conscious effort to harm women.”

That sounds right to me. I’m pretty sure that the vast majority of physicists are well-intentioned in this area: most of us genuinely believe that it would be better to have more women in physics and would never deliberately discriminate against women. The sad thing is that this may not be enough.

As our department gears up to search for a new faculty member, this is certainly something we’ll keep in mind.

Breaking news: quantum mechanics works exactly the way everyone has known it did for 75 years

Different people like different literary genres. I enjoy a good mystery; you may prefer science fiction, horror, or romance. Some people, apparently, can’t get enough of a different genre: breathless news articles claiming that some new result changes our understanding of the foundations of quantum mechanics. Just in the pages of Nature alone you could find enough of these to while away some long winter evenings.

I’ve complained about this sort of thing a couple of times before, and whenever I do I quote John Baez:

Newspapers tend to report the results of these fundamentals-of-QM experiments as if they were shocking and inexplicable threats to known physics. It’s gotten to the point where whenever I read the introduction to one of these articles, I close my eyes and predict what the reported results will be, and I’m always right. The results are always consistent with simply taking quantum mechanics at face value.

Here’s the latest, from Nature:

 Heisenberg sometimes explained the uncertainty principle as a problem of making measurements. His most well-known thought experiment involved photographing an electron. To take the picture, a scientist might bounce a light particle off the electron’s surface. That would reveal its position, but it would also impart energy to the electron, causing it to move. Learning about the electron’s position would create uncertainty in its velocity; and the act of measurement would produce the uncertainty needed to satisfy the principle.

Physics students are still taught this measurement-disturbance version of the uncertainty principle in introductory classes, but it turns out that it’s not always true. Aephraim Steinberg of the University of Toronto in Canada and his team have performed measurements on photons (particles of light) and showed that the act of measuring can introduce less uncertainty than is required by Heisenberg’s principle1. The total uncertainty of what can be known about the photon’s properties, however, remains above Heisenberg’s limit.

Now there’s absolutely nothing wrong with the above. What I object to is the notion that this is (a) new, (b) surprising, or (c) Nature-worthy. No doubt some people who teach quantum mechanics still teach that the uncertainty principle always has to do with uncertainties induced by measurements, but I hope not many practicing physicists do so.

What I really object to, though, is the last sentence of the abstract of the journal article to which this news article refers:

 [This experiment’s] results have broad implications for the foundations of quantum mechanics and for practical issues in quantum measurement.

I can’t find anything in the article that substantiates this claim, and the claim itself is ridiculous on its face. It’s ridiculous because, although some people who write woo-woo popular treatments of quantum mechanics get this wrong, nobody who’s actually studied the foundations of quantum mechanics or quantum measurement theory does. The results of this experiment confirm exactly what such people would have expected all along.

That’s not to say that one shouldn’t do the experiment, of course. I’m not opposed to checking whether things that everyone knows must happen really do happen! But it’s absurd to say that the results have broad implications about the foundations of the field.

For those who know a bit of quantum mechanics, I’ll give an example below of a thought experiment that illustrates the idea behind the actual experiment. Just to be clear, this is a completely different physical setup, but the underlying principles and the relationship to the uncertainty principle are precisely analogous.

Continue reading Breaking news: quantum mechanics works exactly the way everyone has known it did for 75 years

Two papers submitted

A collaboration I’m part of submitted two papers for publication this week, containing the first batch of results from an ongoing effort to simulate interferometric observations of cosmic microwave background polarization.

If you don’t already know what all the words in that last sentence mean, you probably won’t be terribly interested in the papers. Here’s the executive summary of the project as a whole:

  • The cosmic microwave background radiation, which is the oldest light in the Universe, contains bunches of information about what things were like shortly after the Big Bang.
  • There are very good reasons to believe that highly sensitive measurements of the polarization of this radiation will give us extremely valuable information that we can’t get any other way, but sufficiently sensitive measurements haven’t been made yet.
  • Consequently, lots of people are trying to make those sensitive measurements.
  • We’re interested in the possibility that a kind of instrument called an interferometer  may do better than traditional imaging telescopes at keeping various possible sources of error under control.
  • To see whether this is true, and if so to try to convince other people (e.g., funding agencies) that this is a good way to make these measurements, we’re simulating the performance of these instruments.

As usual, the vast majority of the work that went into these papers was done by the young people, Brown graduate student Ata Karakci and Wisconsin postdoc Le Zhang.

Titles, abstracts, links for those who want them:

Karakci et al., Bayesian Inference of Polarized CMB Power Spectra from Interferometric Data, arXiv:1209.2930.

Detection of B-mode polarization of the cosmic microwave background (CMB) radiation is one of the frontiers of observational cosmology. Because they are an order of magnitude fainter than E-modes, it is quite a challenge to detect B-modes. Having more manageable systematics, interferometers prove to have a substantial advantage over imagers in detecting such faint signals. Here, we present a method for Bayesian inference of power spectra and signal reconstruction from interferometric data of the CMB polarization signal by using the technique of Gibbs sampling. We demonstrate the validity of the method in the flat-sky approximation for a simulation of an interferometric observation on a finite patch with incomplete uv-plane coverage, a finite beam size and a realistic noise model. With a computational complexity of O(n3/2), n being the data size, Gibbs sampling provides an efficient method for analyzing upcoming cosmology observations.

Zhang et al., Maximum likelihood analysis of systematic errors in interferometric observations of the cosmic microwave background, arxiv:1209.2676.

We investigate the impact of instrumental systematic errors in interferometric measurements of the cosmic microwave background (CMB) temperature and polarization power spectra. We simulate interferometric CMB observations to generate mock visibilities and estimate power spectra using the statistically optimal maximum likelihood technique. We define a quadratic error measure to determine allowable levels of systematic error that do not induce power spectrum errors beyond a given tolerance. As an example, in this study we focus on differential pointing errors. The effects of other systematics can be simulated by this pipeline in a straightforward manner. We find that, in order to accurately recover the underlying B-modes for r=0.01 at 28 < l < 384, Gaussian-distributed pointing errors must be controlled to 0.7 degrees rms for an interferometer with an antenna configuration similar to QUBIC, in agreement with analytical estimates. Only the statistical uncertainty for 28 < l < 88 would be changed at ~10% level. We also show that the impact of pointing errors on the TB and EB measurements is negligibly small.

Ptolemy and Copernicus

I’m teaching my first-year seminar, Space is Big, again this fall. In the first part of the course we look at the Copernican revolution, when people first* figured out that the Earth goes around the Sun.

Before we get to Copernicus, we spend a while looking at what the ancient Greeks thought about the way the planets move, focusing especially on the Ptolemaic system. I made a few little animations to show some connections between the old Earth-centered view and the Copernican one.

There’s nothing original in what I’m about to say, and nothing that the cognoscenti don’t already know, but there are a few animated gifs that show exactly why the ancient system and the Copernican system were observationally equivalent (and why both were equivalent to the less well-known Tychonic system).

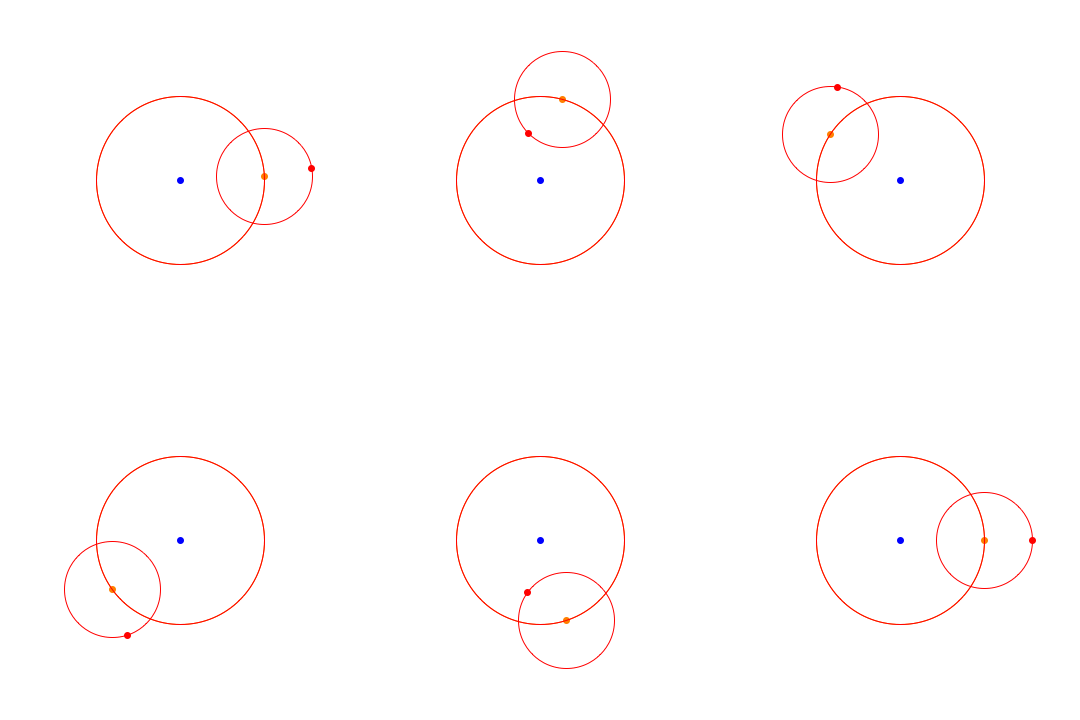
In the Ptolemaic system, the Earth was at rest at the center, and the Sun, Moon, and planets all went around it. Here’s a simplified version of the Ptolemaic model, showing just the Earth (blue dot), Sun (orange dot), and Venus (red dot):

In this model, the Sun goes around the Earth in a circle, but Venus has a more complicated motion, involving a deferent (the big red circle) and an epicycle (the little red circle). This is necessary because Venus (like the other planets) goes through periods of retrograde motion during which its apparent path through the sky reverses direction. In this model, retrograde motion occurs when the epicycle carries Venus close to the Earth: at those times, the epicycle is making Venus go around backwards faster than the deferent is making it go forwards, so it reverses direction.

Actually, Ptolemy’s system was somewhat more complicated than this: to get the motions of the planets right in detail, he needed extra epicycles, as well as things called eccentrics and equants. But the circles in this diagram are the most important ones. They’re all you need to get the gross features of the Sun’s and Venus’s apparent motion right. (Similar epicyle-deferent pairs work for all the other planets; I’m just focusing on one planet to keep things uncluttered.)

Here’s a funny thing about this model: Venus’s epicycle goes around the Earth at exactly the same rate as the Sun (once per year, if you must know). That’s Ptolemy’s way of accounting for the fact that Venus has bounded elongation, which is just a fancy way of saying that Venus always appears near the Sun in the sky. (You’ll never see Venus rising in the east when the Sun is setting in the west, for instance.) One thing that Copernicus found unsatisfying about the Ptolemaic system was that there was no good reason for these two motions to be synchronized like this.

Ptolemy put Venus’s orbit inside the Sun’s orbit, as I’ve shown. But there’s no reason he had to. You could make the Sun’s orbit bigger or smaller by as much as you want, and everything an earthbound observer sees would remain exactly the same. In particular, you could shrink the Sun’s orbit until it was exactly the same size as Venus’s deferent:

Physically, Ptolemy wouldn’t have liked this model. He probably believed that the epicycles and deferents were actual physical objects, so Venus’s and the Sun’s shouldn’t cross each other. But, as he would surely have agreed, this model has the exact same appearance as his original model: if you use the two models to predict where the Sun and Venus will appear in the sky on any given date, you’ll get the same answers.

As a matter of fact, the greatest astronomer of the medieval period, Tycho Brahe, advocated this model, in which the Sun goes around the Earth while Venus (and the other planets) go around the Sun.

Now take the above picture and imagine what it would look like from the point of view of someone standing on the surface of the Sun. That person would see both Venus and Earth circling the Sun like this:

This picture is exactly the same as the previous one, but with a change of reference frame: everything is drawn from the point of view of the Sun rather than the Earth. Once again, the two models are observationally equivalent. If you freeze the two pictures at any moment, the relative positions of Earth, Sun, and Venus will be exactly the same. That means that an Earthbound observer in either of these two pictures will see the exact same motions of Venus and the Sun.

The last picture is how Copernicus explains the motions of the Sun and Venus. The key point is that, although the three pictures are conceptually quite different, they’re all  observationally equivalent. They’re exactly equally good at predicting where Venus and the Sun will appear on any given day.

No matter which of the three models you use, you get a pretty good approximate model of the planetary positions. In all three cases, if you want greater accuracy, you have to throw in extra complication (e.g., extra little epicycles). People sometimes say that Copernicus’s model was better because it eliminated epicycles, but that’s not true: he got rid of the great big ones, but he still needed the little ones.

Copernicus’s model was not any more accurate than Ptolemy’s (in fact, they were essentially equivalent), and it still had some (although not as many) of the clunky features like epicycles. Moreover, it required everyone to believe in the very unlikely-sounding proposition that the Earth, which feels awfully stationary, was in fact whizzing around at enormous speeds. Given all that, it’s not too surprising that people didn’t immediately fall in love with the new theory.

*Well, not quite first. There was Aristarchus, who proposed the idea that the Earth goes around the Sun about 1700 years before Copernicus. But it appears that nobody listened to him.