Nasa’s Climatological Website

Well, hello there gang!

If you ever happen to be looking for information or topics on large scale climate issues then look no further than Nasa’s climatological website. As soon as you visit the site’s homepage you see a wealth of information on a variety of climate issues. How about arctic sea ice levels? Yep, they have that. Carbon Dioxide information? Of course. Sea levels and global temperatures? You bet. How about land ice, do they do land ice? Most definitely.

There are also tabs on the homepage related to key indicators like carbon dioxide concentration, evidence like sea level rising, causes like greenhouse gases, effects like weather intensification, and uncertainties like the effects of solar output on Earth.  The tabs for each of these climatological phenomena are easily accessible in the event that any skeptics visit the site at any point. If you ever need to make an argument for the existence of climate change, this website is a fantastic place to start your research for such an arguement.

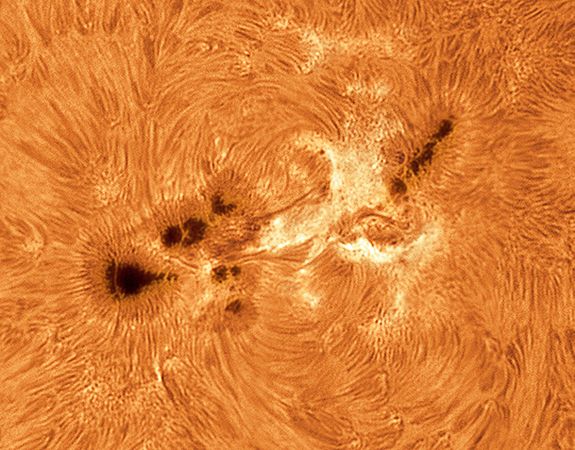
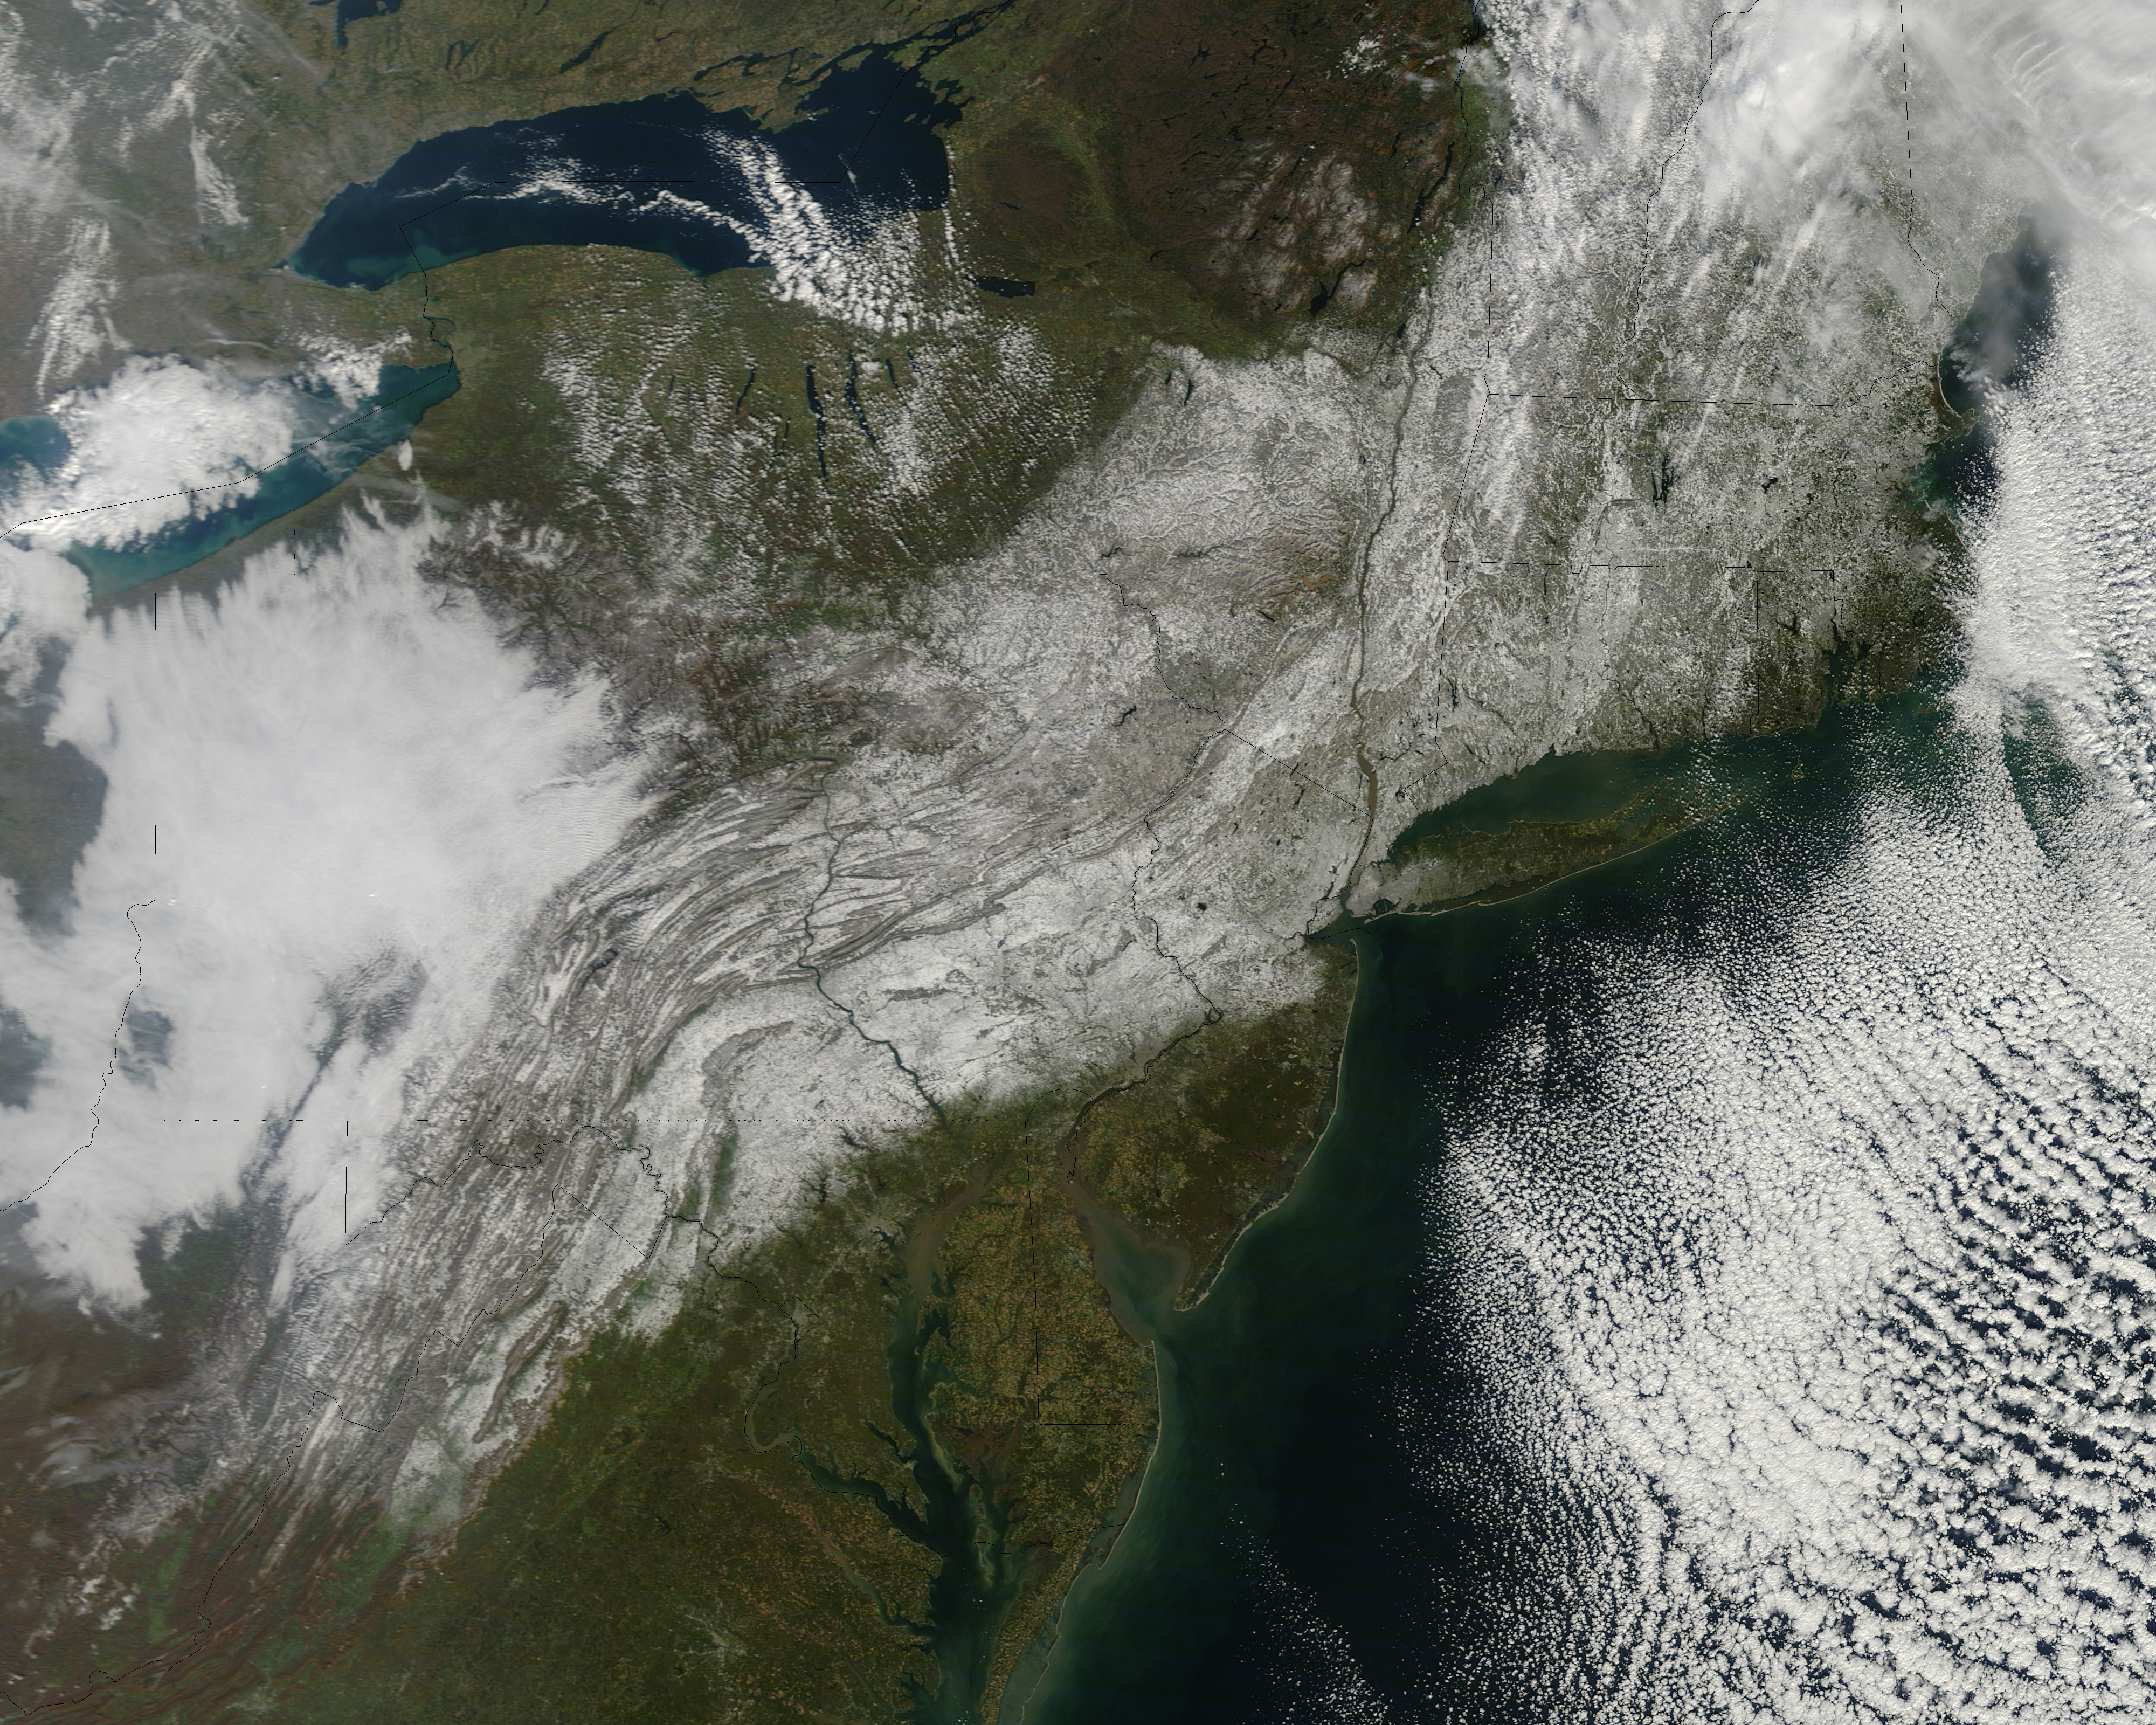
Perhaps the most persuasive and fascinating aspect of Nasa’s climate website is the wide selection they have of satellite imagery obtained by one of their three Earth orbiting satellites (called “Grace,” “AIRS,” and “Jason-1”) like this:

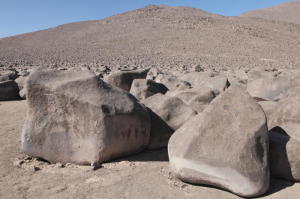
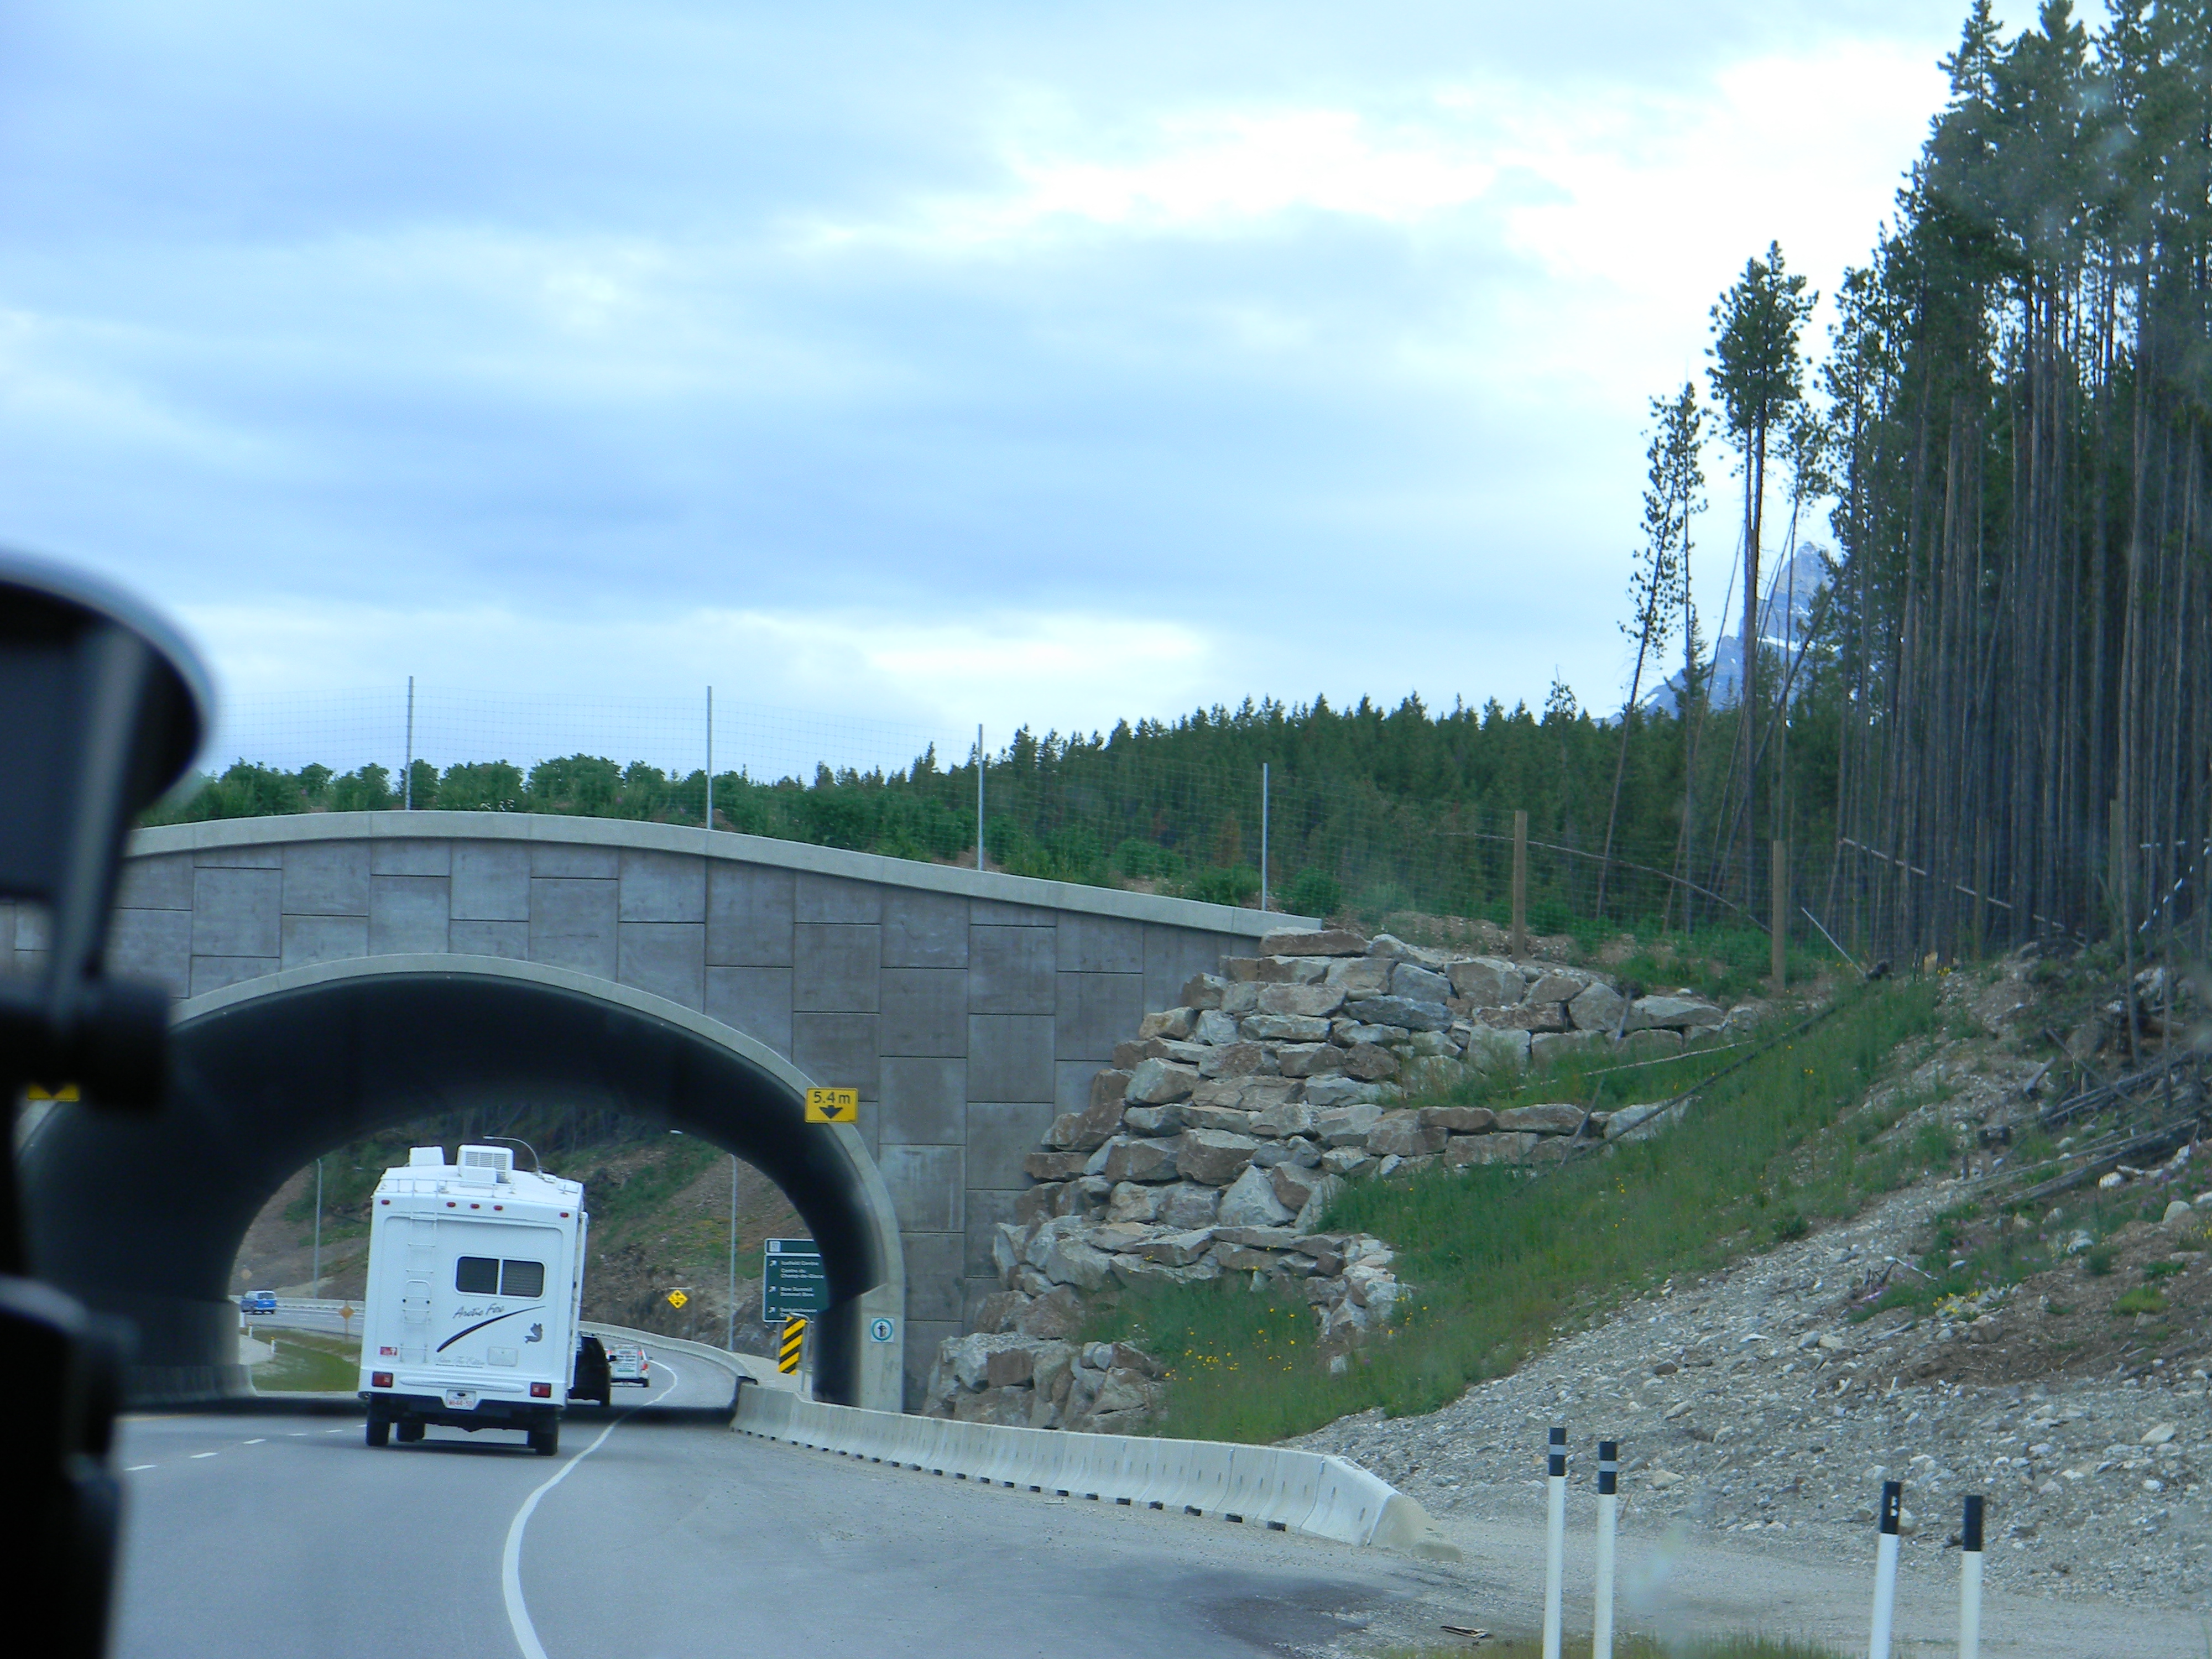
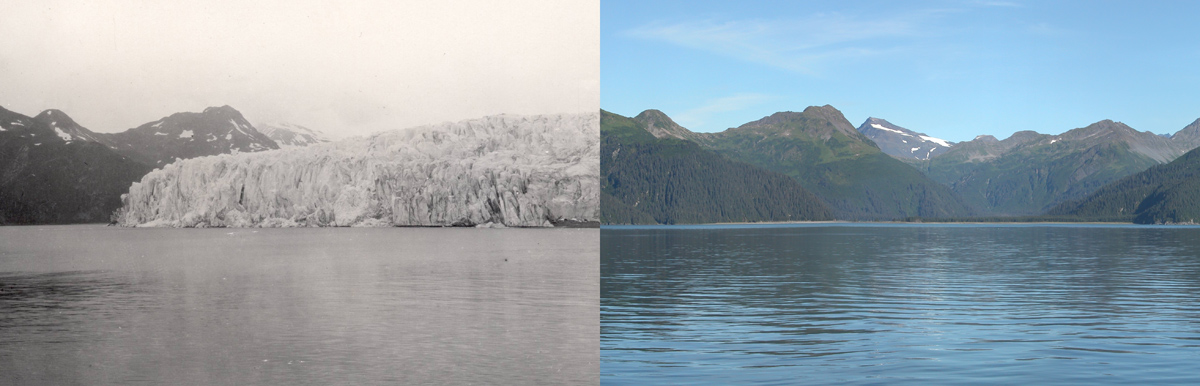
Of the images on the website, Nasa also has a wide array of photographs taken from people in the field like this:

Whether you’re doing research in order to debate against a climate change skeptic, for school, or for your own personal interest, Nasa’s climate website ought to be your first stop!

Science Daily

Hey everyone! It took me a while to decide on a geography related website to post in the blog. Ironically, the site I finally chose, sciencedaily.com, has been a favorite repository of random scientific facts and knowledge for a while now for both myself and my father (it is my dad’s homepage, so every time I use dad’s computer I am greeted with the latest interesting scientific news. My dad does not qualify as a scientist (he sells beer for a living), but every time he finds something cool on Science Daily he emails it to me. Like literally every time haha). Anyway, when you log on to Science Daily you immediately see the days top headlines in the scientific world. For example, today’s top stories include titles such as Ancient Stars Shed Light On the Milky Way, Whiskers: Milestone in Evolution of Mammals,  The Strange Rubbing Boulders of the Atacama, and Bats Can Rapidly Change Ear Shapes. Everytime that I log on I tend to unconsciously dedicate 15 to 20 minutes of my time sifting through novel discoveries.

Today’s most interesting topic was about the unique boulders of the Atacama Desert, which ties in nicely with out recent study of the lithosphere and weathering processes. The large , smooth boulders found in the driest desert on earth were dislodged from hills surrounding the various basins located in the desert. Due to frequent seismic activity and earthquakes, the boulders, which have been in the basin for nearly 2 million years, rub against each other many times over the course of geologic time which creates their characteristic smooth sides. This process of weathering is extremely rare, and can only be found in areas of extremely low rainfall and high seismic activity, two conditions characteristic of the Atacama Desert. A picture of the boulders taken from the article is shown below.

The website contains a lot of other cool features that allow you to find articles regarding specific topics. These topics vary temendously and include a myriad of topics associated with the atmosphere, hydrosphere, lithosphere and biosphere. For instance, one of today’s articles, titled Evidence of Ancient Lake in California’s Eel River Emerges, credits a past catastrophic landslide with the creation of a lake that affected, and still today affects, the gene’s of the region’s steelhead trout. It is a fascinating study that connects changes in the lithosphere and hydrosphere dictating changes in the biosphere. This article could be found under 3 different tabs (Plants & Animals, Earth & Climate, Fossils & Ruins), further proving the interconnectedness of the science of physical geography. Geography itself is a topic tagged in many of the posts, including an article about the spatial distribution of long-term carbon storage in the Ganges Basin. This website is really interesting, and like I said, if you spend a couple of minutes searching through the varying articles you are bound to learn something really interesting!


THE MOST INTERESTING BLOG EVER-PLEASE COMMENT!

About Project Noah: http://www.projectnoah.org/about

I came across the website through an advertisement on the National Geographic Website. Clicking on the link soon lead me to an interesting project that four NYU graduates have created. Entitled “Project Noah”, the experiment attempts to build a fun, location-based database mapping out wild-life intercations all around the world. The way Project Noah works is that anywhere at anytime, if you come across an organism, you take a picture of it, post it on the website, and attribute a location to where you spotted it. Oftentimes, members do not know the “official” names of the organisms that they take pictures of- but that is where the social networking aspect of Project Noah comes in. On the website, you can post and comment on the pictures by writing the name of the organism or general feelings toward the picture.

Another aspect of Project Noah is that it conveys the vast biodiversity around the world. With over 120,000 participants, and over millions of pictures uploaded, Project Noah serves as a catalog for speicies diversity and dispersion. Members can also participate in “missions”, which link all the classified organism pictures into a central location such as the National Saguaro Park. This helps scientists count and identify the certain species in the Park.

Project noah’s most notable feature is that it can be downloaded as an app, so pictures and categroizations can be uploaded easily and at any time. I see this whole project as a way to encourage people to reconnect with nature, documenting local wildlife, and creating “citizen-scientists”.

Banff Wildlife Crossings Project

This summer I visited Banff National Park in Alberta, Canada and we spent a lot of time driving on the Trans-Canada Highway. All along the TCH in Banff National Park, there are wildlife overpasses and underpasses that allow wildlife to safely cross the road without risking collision with vehicles on the road. I took a picture of one of the two overpasses currently in the park (it’s a little blurry). Having learned about habitat fragmentation and the importance of corridors in other classes, I decided to look more into this specific case.

The purpose of wildlife underpasses and overpasses is not only to protect the animals from the immediate risk of road mortality caused by park infrastructure, but also to help maintain a stable and diverse wildlife population. Because the Trans-Canada Highway is so large and heavily used, it has become a huge barrier for wildlife, which restricts their movement and habitat area, and eventually leads to a less diverse population because they are confined to a smaller habitat patch, and eventually can lead to extinction. Road mortality can also have an effect on a species’ population in a shorter amount of time (1-2 generations) than edge effects caused by the road. The project created is called The Banff Wildlife Crossings Project and was started in 1996.

In Banff National Park, they have created various measures of wildlife crossing structures in order to attempt to solve this problem. There are two wildlife overpasses that span 50-m wide over the highway. They monitored the effects of these wildlife over and underpasses for five years. From this they discovered that they have reduced all road-kill by 80%. As to determine the effect of the over and underpasses on reducing habitat fragmentation, a longer-term study is needed. However, overall the project has been a success.


Chesapeake Bay Shows Signs of Improving Health

Link: http://www.ens-newswire.com/ens/nov2011/2011-11-03-093.html

According to research being performed by scientists at Johns Hopkins University and the University of Maryland Center for Environmental Science, the efforts to clean up the Chesapeake Bay are proving successful.  Water samples compared to those over the last several decades show that the nation’s largest estuary is getting healthier in a sense.

This has come about as a result of reduction of the flow of fertilizers, waste, and other pollutants, which has in turn reduced the overall size of the oxygen-starved dead zones (uninhabitable areas for plants and animals) in the body of water.  Rebecca Murphy, who is part of the Department of Geography and Environmental Engineering at Johns Hopkins, believes that there is a direct correlation between the two occurrences, which seems a good sign for the future of the Chesapeake Bay and other vital water bodies.

The effort to clean up the bay really took hold in the 1980s with the federal Chesapeake Bay Program, which focused on restoring the previous condition of the water.  While this past year did not present the  best data regarding shrinking volume of dead zones, the overall trend in recent years has been positive in that these oxygen deprived areas have been decreasing.  Some scientists were concerned as there have been reports of early summer jumps in dead zone activity, but this has been shown to be a result of climate forces such as heavy rains, wind, salinity, and the sea level of the water.  If not for the efforts to decrease the flow of the contaminants into the Chesapeake Bay, the prevalence of the oxygen starved zones would surely have been worse.

IN SUMMARY: While overall climate change has been having negative effects on the Chesapeake Bay, localized monitoring and pollutant reduction has lessened the issues. Hooray for a positive (or at least less negative) development!


Sunspots, Active Region 1339

By: Shane Sullivan

Sunspots are magnetic storms on the surface of the Sun which are sometimes visible from Earth as black dots on the surface of the Sun. Recently scientists observed the largest group of sunspots seen since 2005 which collectively are “approximately 17 times the width of our planet”. This group of spots has been named active region (AR) 1339 and is of particular interest to scientists because of its current orientation in relation to the Earth.

“A picture of the sunspot cluster known as AR 1339 taken with a backyard telescope”

AR 1339 is now located in the center of the Sun directly pointing towards Earth which has the potential to cause damages to satellites and humans if solar flares become active. Although, the last solar flare activity recorded from AR 1339 was on the 3rd of November flares can become active anytime and are at most detectable within minutes of the occurrence. These flares have a high potential to disrupt satellites and due to radiation exposure pose health risks to airline pilots and scientists aboard the space station.

While AR 1339 is visible to the naked eye Philip H. Scherrer, a Stanford professor, warns, like Tiho, that “people should never look directly at the sun”.

http://news.nationalgeographic.com/news/2011/11/111110-sunspots-ar1339-earth-jupiter-solar-flare-auroras-space-science/

Snowtober 2011 in the Northeast

The North East and Mid-Atlantic region of the United States (from West Virginia to Maine) experienced an unseasonably early snow storm on the weekend of Halloween, October 29-30, 2011. The nor’easter brought as much as 81 inches of snow in some places and the weight of the snow on the still-attached leaves, made branches to snap more easily. The snapping of trees led to many downed power lines and a chaotic attempts by utilities personnel to restore power. Over 3 million homes lost power during this time, exceeding the number of power outages experienced in September 2011’s Hurricane Irene.

Central Park in New York City broke records – it was the only time in its history that snow accumulation exceeded 1-2 inches within the month of October. By the first morning of the storm on Saturday, October 29, 2011, Central Park had already received 2.9 inches of snow.  The storm also brought New York City closer to the “all-time wettest” year in its history,  In total, the storm gave New York City 65.75 inches of precipitation – over 2 feet above average! In New Hampshire and Massachusetts, 31.4 inches and 32 inches of snow were produced, also above average during the month of October. According to NOAA, the Northeast had 86% snow cover with approximately 4” deep. Very, very unusual.

http://earthobservatory.nasa.gov/IOTD/view.php?id=76267

NASA's "Image of The Day" during Snowtober 2011

One weather historian Christopher Burton has called the storm, “the most extraordinary October snowstorm in over two centuries in the northeastern US”. This unseasonable snowstorm is further proof of a warming world. With warmer temperatures, the atmosphere is able to hold more moisture and thus heavier precipitation. With temperatures falling just below freezing during late October 2011, this precipitation came down as snowfall.


Freedman, A. (2011, October 31). Historic October Northeast storm: Epic. Incredible. Downright ridiculous. Capital Weather Gang. The Washington Post. Accessed November 5, 2011

Economic Prosperity at the Environment’s Expense: Different Resource, Same Outcome?

Two Rivers: The Chance to Export Power Divides Southeast Asia

By Jeff Smith (National Geographic)- 10/25/11

River picture: A person wades in the Irrawaddy River. http://news.nationalgeographic.com/news/energy/2011/10/111026-mekong-irrawaddy-hydropower-dams/

Despite being two separate waterways, the Mekong and Irrawaddy Rivers are crucial to both the human and animal population that currently rely on it to survive. As China continues to grow industrially at its current rate, on a continent that is“energy hungry,” Laos and Burma are in the midst of determining the economic benefits and environmental downfalls of constructing hydropower dams on the rivers.

Hydropower dams have potentially devastating consequences for migratory fish and wetland ecology along the rivers. They redistribute water with the mindset that producing energy is the main goal. Generally speaking, dry season river flows tend to increase while the wet season peak flows tend to decrease in order to maintain the proper levels of energy production. While this would seemingly lead to a more hands on approach to flood control that is not the main priority of these dams, and thus, not a guarantee.

The risks for these projects are straightforward: besides from the obvious environmental disruption, it threatens the ecology and animal habitats it supports.  Additionally, it threatens to disrupt the livelihoods of fishermen and farmers alike who rely on its flow to support  their families and are the economic engine for small villages along the river. Contrastingly, a hydropower dam will generate potentially billions of dollars by exporting the megawatts of energy it produces to countries such as China and other neighboring countries where energy is in high demand.

Intriguingly, Laos has seemingly accepted the risks and has moved forward with construction of a dam on the Mekong River whereas in Burma, the government has ceased work on the construction of the dam in the Irrawaddy River. The Irrawaddy has significant spiritual significance for much of the Burmese population who were surprised by the government’s democratic acceptance of the public’s outcry.  Although many activist groups in Laos are fighting intensely to have the government overturn its decision to move forward with the project it is likely that both countries are still in limbo. It will be interesting to see what the near future holds.


Hopefully, we can get a conversation started about the following environmental ethics debate.

*As the world is demanding more and more energy and there is an increasing global push for alternative  forms of energy (rather than fossil fuel), is risking the ecology and habitats of these rivers a worthwhile investment environmentally speaking? Clearly the economic incentive is there, but as the fossil fuels of the world continue to decrease while simultaneously affecting our climate, is hydroelectric power a reasonable, if not, crucial alternative in the coming years?


What’s Your Pollution Scorecard?

Coal-fired power plantDespite the success of national legislation like the Clean Air Act, the Clean Water Act, and the Federal Insecticide, Fungicide, and Rodenticide Act, pollutants still enter the environment at alarming rates. We can easily identify obvious sources of pollution—sulfur dioxide is bound to be coming out of a coal-fired power plant’s smokestacks—yet often less-obvious sources go unnoticed.

When pollution from any of these sources enters the environment, the substance likely enters either the air, local ground or surface water, or the soil; some of these substances may remain in these locations for many years. These chemicals have obvious effects: human and environmental health suffer in a variety of ways.

Nevertheless, the landscape of the region and the physical distance from a polluter means that some locations will experience only minimal levels of a pollutant. Wind and other weather patterns could transport a pollutant away from region and toward another; a city-dweller living next door to a factory will inhale many more toxic chemicals than will a rural farmer living kilometers away.

Luckily (or not, depending on your perspective) there is an online tool to determine which polluters exist in your locality. By visiting Scorecard, you can input your home or current zip code and get a list of polluters in your locality, the location of those polluters, how much pollutant they emit, and which pollutants are most prevalent where you live. For instance, I learned a company was emitting lead-based compounds from what I thought was an office building adjacent to the suburban neighborhood where I grew up! You can also see if any Superfund sites exist near you, determine the cleanliness of your local water, and learn what percentage of homes in your area have risk for hazardous levels of lead.

How many polluters are in your locality? Are you surprised at what you find out? Let us know in the comments!

Bill Nye the Science Guy on Climate Change

by Amanda Doyle

He taught us the physics behind flight, mechanisms in an eyeball, and layers of the atmosphere (all accompanied by pop music parodies), but now, Bill Nye the Science Guy tackles a much more difficult issue… climate change.  An advocate himself, Bill makes frequent appearances at universities and conventions, and on news broadcasts addressing this modern concern.  In February 2010, soon after a blizzard crippled Washington D.C.,  Bill spoke on MSNBC as a guest of Rachel Maddow.  Many disbelieving politicians utilized the blizzard to debunk the theory of global warming; however, Bill explained that climate change may have been the driving force that created the catastrophic storm.  Accustomed to educating an elementary audience Bill provided a clear and concise explanation of climate change, one both students and elders alike could understand and appreciate.


Bill Nye Science Guy on Rachel Maddow Talking About Climate Change
msnbc, “Bill Nye Science Guy on Rachel Maddow Talking About Climate Change,” Youtube video, http://www.youtube.com/watch?v=sm05Mcah0i8 (accessed October 1,2011).

First, Bill clarifies that global warming was the initial term to address this phenomenon but since global warming created numerous misconceptions the current accepted expression is climate change.  He continues to explain that more energy is being trapped within Earth’s atmosphere and all of this energy is “stirring things up.”  Consequently, the world is warming leading to more intense phenomena, such as El Niño, which has a profound effect on weather in North America.  When Sea Surface Temperatures (SSTs) increase during El Niño more energy is released into the atmosphere making conditions more turbulent and resulting in extreme weather that can range from extreme drought, excessive rain, and even atypical snowstorms.

Lastly, Bill states that disbelievers of climate change are “unpatriotic,” and he reminds us that the Intergovernmental Panel on Climate Change received a Nobel Prize for their extensive research that brought to light this phenomenon, which will remain a heated topic of debate for years to come.