How much do you know about volcanoes?


Have you ever wondered how many volcanoes there are in your country, or how many earthquakes have occurred in the past 24 hours? Have you ever wanted to travel and see a volcano, but you don’t know where to start? www.volcanodiscovery.com is a great website if you want to know anything and everything about the geography of volcanoes. When you first go to the website, there are simple categories on what you are specifically looking for. For example, if you click on the first box that says “Volcanoes of the world,” there is information and news about active volcanoes from all around the world. You could click on a country such as Japan, for example, to find out how many volcanoes are on that island, and find out facts about them. You could also click on the category called “Volcano photos,” to see magnificent photographs of different types of active volcanoes. There is also a “photo of the day” category, in which you could check back every day to see a new photo. Another interesting category is the “Volcano travel,” in which you could find out where you can visit to see volcanoes. There are even specific dates and tours that you could sign up for. Another category that is convenient is the “Latest earthquakes” category. Here, you can find out the latest earthquakes from around the world and their magnitudes.

Cold to Hot! A study of How the Ice-covered Earth Heated Up To Record Temperatures

Researchers at the University of Texas — Austin Jackson School of the Geosciences have recently conducted a study, featured in the April 22, 2016, edition of Science, hypothesizing that volcanic activity associated with plate tectonic movement is a contributing factor to the global climatic shift to higher temperatures. This study analyzes shifts in the Earth’s baseline climate throughout Earth’s 4.6 billion year existence; the study focuses on long-term shift, not short-term/human-induced climate change. The researchers, using a geomorphological lens to examine climate change shifts concluded, ” periods when volcanoes along continental arcs were more active coincided with warmer, or greenhouse, conditions over the past 720 million years. Conversely,  periods when continental arc volcanos were less active coincided with colder, or icehouse, conditions” (University of Texas at Austin). The research team argues that when crustal collisions occur throughout Earth’s history, the effects of plates colliding can increase Earth’s temperatures, especially collisions that result in volcano formation.

Continental arc systems, the researchers argue, act as reservoir for carbon, until volcanic eruption releases carbon into the atmosphere. Continental arc systems are created by the collision of two tectonic plates and the oceanic plate is subverted by the continental plate, forming a subduction zone where magma mixes with trapped carbon to release carbon dioxide when volcanoes erupt.  The amount of carbon dioxide released and held in the atmosphere “influences Earth’s climate.” The research team compiled over 200 published studies, in addition to their own data, to study the past 720 million years of Earth’s geology. The team constructed a global database cataloging the most recent 720 million years of volcanic activity at the margins of the continental plates. The study also examined other greenhouse gases and sediment basins of eroded volcanic structures in order to improve their model.

In concluding statements, team contributor Brian Horton stated, “the cooler icehouse periods tended to correlate with the assembly of the Earth’s supercontinents, which was a time of diminished continental volcanism. The warmer greenhouse periods correlated with continental breakup, a time of enhanced continental volcanism.” This study is important to physical geography because it is representative of the interconnectedness and interdependence Earth’s systems have with one another. The lithosphere and the atmosphere are not independent of each other, but exogenic processes that occur in one sphere or system of the Earth affects the other system.

Source: https://www.sciencedaily.com/releases/2016/04/160421150056.htm


Google Earth Guessing Game

This site will bring you to a random spot on google earth and the challenge is to guess where in the world you are. There are many strategies you can use to figure out where you are. A common one is street signs if you can find them, but if you do not recognize the language or are not near any landmarks, the physical geography of the location can be a helpful tool to narrow down where you might be. For example, if you recognize french on a street sign but cannot read it, and there is snowy or mountainous terrain, you might be able to guess that you are in the Alps or maybe Quebec. It is really interesting to see different parts of the world up close that nobody would ever really visit. Also having taken this course, you will have new tools to help figure out where you are.

Algal Toxins Detected in One-Third of Streams Assessed in Southeastern United States

In the first study of its kind, scientists from The United States Geographical Survey have determined that microcystins, a toxin produced by algae, infect 39% of small streams in the South East. However this number is subject to grow as 74% of streams contained cyanobacteria, which is capable of producing microcystins. Human ingestion or just exposure to microcysins can result in nausea, dermatitis, and liver failure. Wild and domestic animals experiences similar side effects. According to the World Health Organization’s standards, none of the streams held a concentration high enough to exceed the moderate risk threshold, but more research is showing that this standard is not necessarily accurate, which is disconcerting especially when it comes to human health. Similarly, the effects of this toxin may be amplified downstream in drinking water supplies and aquatic ecosystems.

Many attribute these high levels to the increasing development and suburbanization of the South Eastern United States. We replace hardwood forests and Spartan grass lowlands with expansive parking lots and manicured lawns, thus turning our watersheds into cement funnels. This lack of riparian buffers compounded with the increasing use of systems (i.e. agriculture and sewage) that leach nutrients like nitrates and phosphorous exponentially increases the amount of nutrient runoff, algal blooms, and thus microcystins in our water.

Rocks Reveal New, Ancient Super Continent

University of Wyoming Researcher, Kevin Chamberlain, has helped disprove a previously wide-held theory of two Precambrian super continents (called Nuna-Columbia and Rodinia) using a technique called “diking,” which examines specific types of layers in rocks called dikes. Chamberlain examined “mafic” dikes in layers of rock, which are dark bands of mineral or rock containing magnesium and iron that form between existing, older rocks. Chamberlain found similar dike swarms (cluster of dikes within the continental crust) in the Southern regions of Siberia and mountain ranges of Wyoming, as well as similar ages of cratons and dike swarms in the two regions. This helped determine when and where the cratons split apart and caused continent reformation, which proved that the Southern region of Siberia and the core of North America where Wyoming’s mountain ranges fall were connected at one point. The findings helped Chamberlain conclude that these regions were connected for about 1.2 billion years, anywhere from 1.9 to 700 million years ago, as one of four or five hypothesized super continent cycles.

The discovery also brought good news to the futures of mining companies. The uncovering of similar dike swarms and craton ages in the two geographic regions reveal that large metal deposits are likely to exist under the younger layers of rock.

Find the article at : https://www.sciencedaily.com/releases/2016/04/160412091348.htm

Worldometers.info – Live Statistics on EVERYTHING, Updated Right Before Your Eyes

Worldometers.info

Worldometers is a fascinating website that shows visitors real-time statistics on a wide range of categories. The categories include world population, government & economics, society & media, the environment, food, water, energy, and health. While some of the statistics are exactly what you would expect, such as current world population or deaths caused by alcohol and smoking, the real beauty of this website is its ability to update these statistics in real time right in front of your eyes. As long as it’s taken me to type this paragraph, the 8 million cigarettes have been smoked, 100,000 tons of carbon dioxide has been pumped into the atmosphere, and 2,000 television sets have been purchased.

Some of the statistics are lighthearted and mildly interesting, like amount of books published this year (773,324), tweets sent today (600,000), or emails sent today (215,000 currently and rising rapidly). Most of the statistics are grim, and are made even more so by the constant update. Some of these unfortunate statistics are fortunately ticking up slowly – the 2,975,612 tons of toxic chemicals released into the environment this year has only risen by a dozen in the last few minutes. Forest loss rises similarly slowly, currently at 1,580,296 hectares. Desertification is a little faster, and has already reached 3,646,502 hectares.

Not all of the statistics are so negative, however: the counter of MWh produced by renewable resources is slowly but steadily catching up to MWh produced by non-renewables, and the largest number on the entire site by far is the MWh of energy produced by solar energy that has struck the earth TODAY. Worldomoter also includes statistics on days until the end of gas (59,166), days until the end of coal (150,336), and barrels of oil left (1,154,233,840,000) which is decreasing close to 1,000 per second.

What I think Worldometer does best is to put things in perspective: there are so many deaths every second, yet so many births per second, that the net increase ends up being relatively slow. For every undernourished person (772,984,307), there is almost 2 overweight people. Every time an individual beats malnutrition, someone else is diagnosed as obese. This is the only time I’ve ever seen any of these statistics flash before me like this and I have to say it’s very eye-opening. Each live statistic can be expanded to reveal even more detail and links to other sites or statistics where you can find out more. From a physical geographer’s standpoint, this site is a treasure trove of information about amounts and rates of countless statistics all applicable to Earth’s systems.

U.S Geological Survey M6.2 – 7km SW of Ueki, Japan

For the “In The News” assignment from a Geography site, an article from the United States Geological Survey website was found to be extremely relevant. The article covers the recent earthquake in Japan that occured last Thursday, April 14th 2016. The earthquake in question had a magnitude of 6.2 and occurred North of Kumamoto, on the island Kyushu in Southwestern Japan. This is considered a moderate/strong earthquake. To put this into context, the devastating 2010 earthquake in Haiti had a magnitude of 7.0. The United States Geography Survey determined the earthquake to be a result of Strike Slip faulting one either a left-lateral strike faulting to the north-west or a right lateral strike faulting the North-east. Due to the Ryukyu Trench, which marks the boundary where the Philippine Sea Plate meets the Eurasia plates, the faulting actions of this earthquake suggests that it occurred within a crustal fault of the Eurasia plate. Thirteen shallow earthquakes, like the April 14th activity, with a seismic rating of 5.0 or more have occurred in Kyushu in the past century but have only caused injury to both people and the environment, no deaths.7 aftershocks have been located due to this earthquake. This article exhibits the real life effects of plate tectonics that we’ve been studying in class. The strike slip fault that between the continental Eurasia plate and the oceanic Philippine Sea plate exhibited exactly the real life outcomes that can occur presented in the textbook.

Chernobyl: 30 Years Later

Pripyat, Ukraine is home to one of the worst nuclear disasters in history. The Chernobyl nuclear power plant disaster of 1986 turned this once bustling city into a ghost of its former self in a matter of two days. Now, all that remains are the desolate skyscrapers, small proof that life ever even existed there at all. Until Now.

The Chernobyl Exclusion Zone is an area which extends 30 km in every direction around the now defunct Chernobyl Nuclear Power Plant. The government maintains this zone, and entry has been strictly prohibited to the public for many years following the meltdown. Only very recently have tours begun circulating through the region, offering brave sightseers a glimpse at the consequences of true nuclear fallout. Most tourists that travel to the region expect to see no life at all, but fortunately for the ecosystem, they will now be mistaken.

Enter Maria Shkvyria, a wolf expert at Ukraine’s National Academy of Sciences, who claims that wildlife in the Exclusion Zone is now thriving. Shkvyria, along with other scientists, believes that the lack of human interference in the area has made it a safe haven for a diverse array of wildlife, despite the high levels of radiation. Camera traps set up by the academy have captured images of bison, boars, badgers, raccoons, foxes, and wolves, a startling sight in a once barren wasteland.

Although this population increase is encouraging, scientists are still divided as to whether or not the current levels of radiation still pose a threat to the long term sustainability of the ecosystem. Many believe that the contamination in the surrounding waters and plant life is still too high, and the population increase will begin to level off as animals begin to feel the effects of long term exposure.

In summation, only time will tell, but for now as one scientist put it, “…without humans around, the wildlife seems to be doing alright”.

Link: http://news.nationalgeographic.com/2016/04/060418-chernobyl-wildlife-thirty-year-anniversary-science/

Diking: A New Source for Earthquake Activity

Researchers from Penn. State University have discovered a new geological source for strong earthquakes known as “diking”. Diking can be found all over the globe, but it is a phenomenon that is primarily focused along divergent plate boundaries (e.g. East Africa’s Great Rift Valley). This phenomenon occurs when magma rises from diverging plate boundaries in order to fill empty spaces. The magma then proceeds to cool and form vertical intrusions known as dikes. Although diking is a known phenomenon, “it has not been observed by geophysical techniques…”.

Penn State researchers led a study that explored the connection between two natural disasters that occurred in the Democratic Republic of Congo in 2002. Chrsitelle Wauthier, the assistant professor of Geosciences at Penn. State, led the study in East Africa. The research team studied the eruption of the Nyiragongo Volcano on January 17th, killing over 100 and leaving around 100,000 homeless, and 6.2 magnitude earthquake which hit the town of Kalehe 8 months later.

Although the research team understood that the entrance of magma to the Earth’s crust creates stress and generates seismicity, they were still perplexed by the magnitude of the earthquake that hit Kalehe after the eruption of Nyiragongo. Earthquakes created by the entrance of magma to the Earth’s crust are usually small in magnitude, but the earthquake that hit Kalehe was quite high.

The research team therefore concluded that the rising magma that created dikes were putting pressure on adjacent rocks in the Earth’s crust. The increased pressure of these adjacent rocks accumulated stress upon rocks found on a fault in Kalehe. Therefore, the research team discovered  that dikes have the potential to trigger much larger earthquakes than previously believed.

Source: https://www.sciencedaily.com/releases/2016/02/160208124248.htm


Google Street View Comes To The University of Richmond (somewhat)


360

Most of us have used Google Street View–maybe Google Earth–at one point or another to get a sense or the route they need to take, what’s the area like around their vacation destination or for general information. Prior to finding out about Terrain360, there were times where I wished I would be able to virtually walk a trail before physically walking it to get a sense of what was to come or to plan a trip.

Well, “terrain360.com is your interactive guide to the natural world, providing 360degree, panoramic image maps of some of the most beautiful trails, waterways and cherished landscapes in the World” (Terrain360).

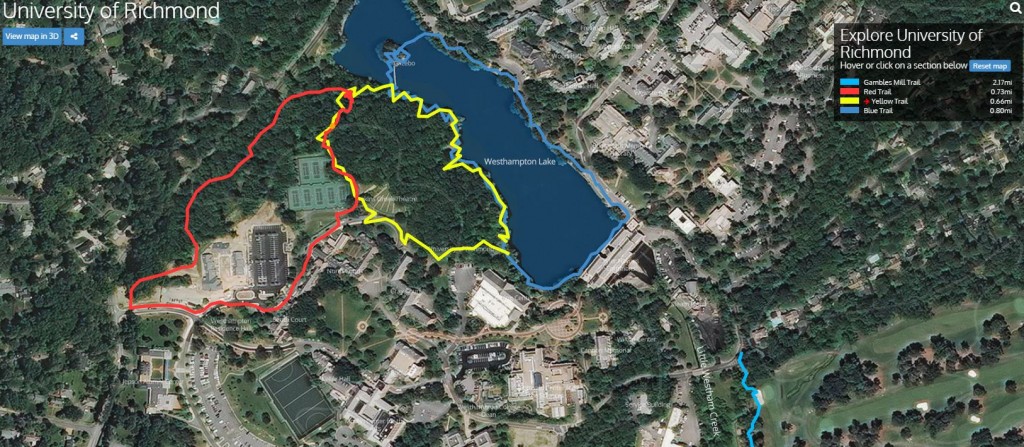
Recently, the software was used at the University of Richmond to provide an interactive view of the trail around the Westhampton Lake, the Gambles Mill Trail, a running trail around campus, and the route to Huguenot Flat Water. All of the trails are accessible by mobile device (with an internet connection) as well as by computer.

Take a look for yourself, just follow the link and click which trail you would like to explore:

University of Richmond Terrain360 Website