Rising sea temperatures is a great concern for our planet in the future. Although the ocean temperature does not warm or cool as dramatically as the land the ocean temperature has increased 0.18 Fahrenheit. This temperature increase may not seem severe but it has caused smaller organisms like krill to decrease in reproduction and has also caused coral to bleach, slowing their growing and making them susceptible to disease. The slow reproduction of krill causes a food shortage for many organisms that feed on them. The rising sea temperatures have also caused stronger storms. The warmer water temperatures create more water vapor, making it easier for storms to increase their size and intensity as they move over the warmer waters. In order to slow rising ocean temperatures we need to dramatically decrease our greenhouse gas emissions. Even if our carbon dioxide emissions level dropped to zero, the gases already present in the atmosphere would take decades before declining. This is a concerning problem that our generation will have to solve for our world to continue to function properly.
Category Archives: Hydrosphere
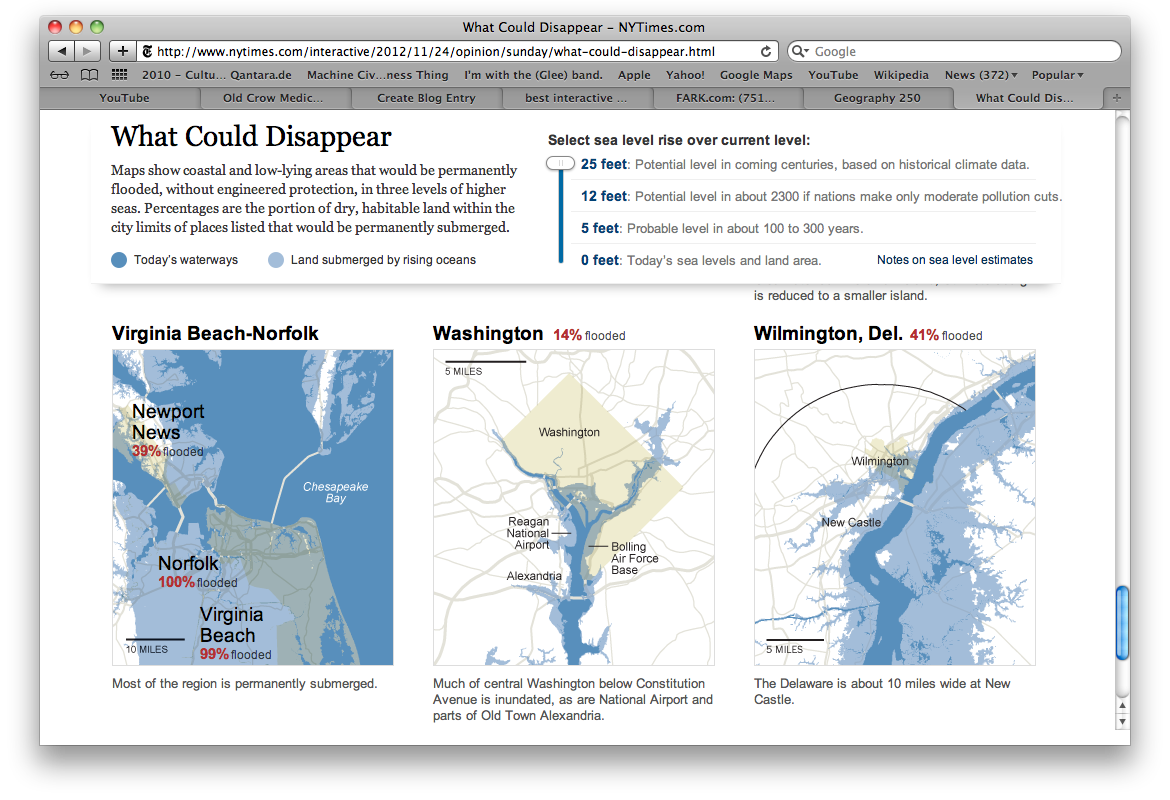
‘What Could Disappear’ with Climate Change
What’s Your Water Footprint?
Ever wondered how your water consumption compared to the national average?
Well now you can find out!
Go on http://environment.nationalgeographic.com/environment/freshwater/water-footprint-calculator/ and calculate your water footprint.
According to National Geographic, almost 95 percent of our water footprints are attributed to these indirect forms of water consumption. This brief and entertaining (watch the duck!) calculation takes into account the water used in your home, diet, energy consumption, travel, as well as the clothes and goods you buy each year.
After talking about the average amount of water used per person in specific countries in class, I found it really intriguing to test how I compared to the national average.
I use 1,451 gallons per day compared to the U.S. average of 1,981 gallons per day. What about you?
Also, underneath the calculator there are a few more interesting and interactive links concerning water usage so check those out too!
James River Report Card 2011
In doing research on the James River in conjunction with our lab and class discussion, I came upon an interesting and relevant report on the current state of the James River. The pdf attached here shows a detailed account of how the James River is doing today, in comparison with recent years and the history since environmental records have been recorded.
The report gives the current state of the river a C overall, a score lower than I anticipated. After our walk around Belle Isle, it seemed like the James was in pretty good shape, but the evidence shows there is significant room for improvement in some areas. In terms of wildlife, the report card confirms that the population of small-mouthed bass has improved, but is still only at about half of the population goal. Another successful area of wildlife in the river system is the bald eagle, which has reached its goal for a healthy population.
The river scored a B- in Habitat, its highest scoring section. While the river has seen improvements overall in the long term, in the short term it is obvious that it still struggles from too many nutrients and sediments, which is leading to abundant algae and poor water clarity. Richmond needs to invest more money in the protection of runoff in order to improve the score for this section.
With regard to pollution and plans for restoration, the river scored a C in both categories. The levels of nitrogen and sediments in the river are still unsustainably high. The city works to protect the area of the river and improve the riparian zones around the river, but more needs to be done in order to bring the James River to the set level of cleanliness.
Questions to think about:
What is a realistic goal for improvement in the river for next year? Which area of the river should Richmond focus on improving? How could efforts be increased? How could awareness in the community and surrounding areas be increased?
Check out the report card here! State of the James River 2011
Source: http://www.jamesriverassociation.org/the-james-river/state-of-the-james/
“My Environment” Interactive Map
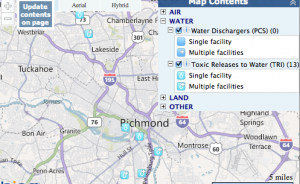
If you are wondering how Richmond compares to other parts of the country in terms of water and energy usage, head to the “My Environment” tool on the EPA website. It allows users to search for cities nationwide, displays a map with local sources of air, water, and land pollution. As geography students, this tool allows us to apply concepts we are learning about water, the atmosphere, and environmental processes to local spaces. The icon for each source reveals the name and address of each potential source of pollutants:
The site also compares local energy production to local energy consumption in terms of coal,natural gas, petroleum, and other sources of energy. Both Virginia and my home state of North Carolina consume more petroleum than any other energy source. While according to the data NC only produces nuclear energy, VA produces coal, natural gas, nuclear, and renewable energy. Data contained on the page is time sensitive, and users can even find out the daily air quality at their location. On the day of this post, my hometown was experiencing the most air pollution from particulate matter, while Richmond’s air was most polluted by carbon monoxide.
The site also encourages community interaction, and contains a “My Community” link where users can report on positive changes being make for the environment. Though the Richmond page does not currently have any news showing, we already know from our geography class that the city of Richmond and the University of Richmond are sensitive to protecting our natural resources.
Australia announces world’s largest MPA

http://www.treehugger.com/ocean-conservation/australia-proposes-creation-of-worlds-largest-marine-reserve-in-coral-sea.html
This past Tuesday, Australia announced its proposal of the largest ever Marine Protected Area. The park will encompass 999,000 square kilometers (roughly 380,000 square miles) of the Coral Sea near Papua New Guinea. Possibly the most interesting aspect of this designation is that over 500,000 square kilometers will be allocated as “No Take Areas” where no fishing of any sort is allowed. This leaves roughly 500,000 square kilometers where fishing and recreation will be heavily regulated. Many environmentalists are outraged calling for a greater proportion of the MPA to be a No Take Area, but the government is trying to balance the interests of their fishing industry as well. The environmentalists stress that No Take areas are crucial in keeping many species from becoming endangered, as they represent their feeding and breeding grounds.

The site is part of Australia’s larger effort to make all of their waters protected. What might be more accurate is saying that Australia plans to heavily regulate all of their waters, considering the absence of No Take Areas. Yet the government is determined to protect and uphold the many treasures that can be found in the waters off its Coast. The MPA proposed has 20 isolate reefs, deep sea plains and canyons, as well as spectacular biodiversity.
Overall, while this park is clearly a step in the right direction for protecting marine and aquatic life there is the overall feeling that more could be done, but because of our reliance on fisheries it has become an interesting predicament for governments to handle.
Farm Fountain
Based in a system of aquaponics, the Farm Fountain presents a unique combination of art and science. It is a system that grows edible plants and fish indoors in an aesthetically pleasing and sustainable manner. The way that it works is the waste filled water from a fish tank is pumped up to the top of the structure and then filtered back down through several 2-liter bottles with edible plants growing in them. The plants then absorb the water and nutrients from the fish waste and the excess water then trickles down back into the fish tank where the process starts over again.
Some of the examples of farm fountain structures can be seen on the farm fountain website. In these examples the structures are used to grow lettuce, cilantro, mint, basil, tomatoes, chives, parsley, and many other garden herbs and vegetables. The fish tank can include fish like tilapia, which can be eaten along with the vegetables. The system offers a great way to grow your own food at home in a cool and sustainable manner. The structures can be set up to use solar power to power the grow lights so that the entire process is sustainable.
This concept applies to our course because earlier in the year we discussed the concept of virtual water and how far food travels before it reaches your plate. With the farm fountain all of your food can be grown right at home. This site gives instructions on how to build your own farm fountain and offers suggestions on what vegetables to grow.
Taking a Closer Look: The Last Ice Area
 http://www.treehugger.com/climate-change/taking-close-look-last-ice-area.html
“I’m melting…I’m melting!!!” (Wicked Witch of the West, Wizard of Oz). This article takes a closer look on how the extreme melting of polar ice caps in the arctic have over-arching effects on several animal species, people and will have long term consequences for our environment.
It has become apparent that this cycle of melting is moving in a clear direction “an ice-free arctic.” There have been projections that the Arctic will experience its first ice-free winter in 2015; what will this mean for the animals and people who depend on this ice environment for survival?
The three major species that will be affected are polar bears, seals and walruses. Polar bears, who have a unique way of hunting seals and fish through gaps and holes in the ice need the sea ice for survival. Without it, polar bears have been driven to dire straits, swimming upwards of 500 miles to find icy hunting grounds, and others resorting to cannibalism for survival.
In terms of other species, it is predicted that the arctic habitat will overlap with that of the grizzly bears by 2040—creating additional threats for animals like walruses and seals. Forced into the Last Ice Area, this small number of remaining various species are clustered extremely close, raising competition levels and making it nearly impossible to find adequate food needed in order to carry on and reproduce.
For the people of the arctic, though warm temperatures might seem as a nice change to many of us, this actually is not the case. These warmer temperatures are in fact destroying their environment, livelihood and economies. With a warmer climate, as “ice melts, shore lines are becoming increasingly unstable, threatening entire towns with rapid erosion and rising sea levels.” Ice trails, important for crossing the ice in the past are disappearing, and as the arctic animals dwindle in population, so thus do the economies of these arctic towns, who depend on these species for the success of their market and general sustenance. As animal species are being forced to move closer and closer inward towards the coast due to the destruction of their icy habitats, this results in “more dangerous interactions between humans and animals.”
This article relates to many of the topics we have discussed in class this semester, showing the very real effects that global warming is having on our environment, and demonstrates what the future holds if we do not take global warming seriously and begin to take substantial action to reduce global emissions. If we do not, ice caps, polar bears and other arctic animals may soon be a thing of the past.
Polar Bears are Dying. EVERY COMMENT SAVES 1,000 POLAR BEAR CUBS!

Rapid loss of sea ice is leading a plummeting polar bear population. Why should we care?
1) Polar Bears are at the top of the artic food chain. If they become extinct then the food web will alter drastically. Certain species, free of competition for food and/or no longer with a main predator, will flourish. However, the environment, as a whole, will suffer. Anthony Ives, a zoologist from the University of Wisconsin, has shown through experimentation that, in general, when a species becomes extinct, the community’s ability to tolerate environmental degradation lessens.
2) So, the extinction of polar bears would prove bad for the overall artic biosphere. Unfortunately, scientists estimate only 20,000 to 25,000 bears are currently living. That number is expected to shrink to as low as 6,500 by 2050.
3) And most importantly, polar bears are not only adorable but they manufacture 30% of the entire world’s supply of Coca-Cola.
Leading scientists hope that if the melting of sea ice is slowed significantly then the polar bear population will stabilize and even start to increase. Unfortunately, slowing the melting of sea ice will require drastic measures.
Comment! What can be done to stop the melting of sea ice? How will dying polar bears affect the artic ecosystem? How much more efficient would polar bears be at manufacturing Coca-Cola products if they had opposable thumbs?
Discovery News – What Can You Discover?
After browsing through several not-so-interesting geography websites, I stumbled upon the Discovery News site. Associated with The Discovery Channel, this site immediately caught my eye with its incredible pictures and interesting headlines. The site is conveniently divided into seven categories ranging between physical geography topics (Earth, Space, and Animals), more cultural geography (Human and History), and just random super cool stories (Tech & Gadgets, Adventure, and Autos). The website is truly engaging because of its numerous videos, photo galleries, and vast array of exciting science articles. Below are some of my favorite stories so far:
1) This incredible series of photographs explores the phenomenon of visual color warnings in plants and animals. The story explains that certain colors, patterns, and visual characteristics can communicate danger.
2) This video talks about a recent eruption of an underwater volcano. It relates to the discussions we had about the lithosphere in class and the difficulty of predicting when volcanoes will erupt. Scientists were however, successfully able to give an 8-year time frame in which the volcano would erupt. Scientists said this site was easier to predict because the crust was thinner and there was a huge supply of magma. The video also gives a cool look at the underwater site.
3) In relation to Matthew Sturm’s article about the changes in tree distribution as a result of climate change, this article discusses the movement of seaweed as a result of global warming. Scientists believe that a profound amount of Australian seaweed is actually moving south in order to find cooler environments.

Seaweed provides an important habitat and food source for many underwater animals. Image by © Jeffrey L. Rotman/CORBIS
4) Last but not least, you can even take a look at the “Be as Manly as Bear Grylles Guide” because let’s be honest, who doesn’t love Bear Grylles?
Share which stories catch your eye!


