BBC – Climate Challenge

With scientists around the world gathering data in support of climate change accelerated by human factors, the BBC created a game to introduce some of the dilemmas this may present to governments around the world.  The goals of the interactive atmosphere is to give players awareness of what causes climate change, describe policy options available to governments, and give a sense of the challenges facing international climate change negotiators.

In this interactive game, you play as the president of the European United Nations, and you represent part of the Intergovernmental panel for climate change.  The game consists of ten turns, with each turn representing a decade.  In each turn, you choose up to six policies to enact during the decade, which impact the economic standing of the European nations, as well as energy, food, and water factors.  Some policies also have a positive or negative environmental impact, to reduce or cause more emissions linked to climate change.  Linked with these policies are popularity meters, based on how the public likes or dislikes the proposed policies – as the President of the European United Nations your job is to establish a strong policy on climate change while keeping the countries happy with your decisions and healthy so that they will continue to elect you to the intergovernmental panel for climate change.

The policies that you choose from in the game are based on actual governmental policy documents (except for those near the end of the game in more futuristic conditions).  The scale of the decisions and their impact was scaled back to a single turn for simplicity, and even with this simplistic model the game presents the player with good background knowledge on where policy makers may be having the most trouble meeting climate change requirements and ensuring cooperation with politicians from other governments.

When I played the Climate Challenge, I tried to meet every goal set for the climate reduction plan every 30 years (3 turns).  While I was effective in keeping my popularity up for the majority of the game and successfully meeting environmental and emission standards, sometimes my concern for the well being of the people in the European Nations wasn’t as high as it should have been. My results page showed scores of Environmental policy: 89% effectiveness; Wealth: 13% effectiveness; Popularity: 20% effectiveness.

The content of the game does a remarkable job of highlighting different consequences for potential actions, placing the player in the role of a politician fighting to recognize climate change and enact policies corresponding to their impact on reducing human impacts on climate change.  It is easy to get lost in the game, learning as you make policy decisions and seeing the potential impacts on the status of nations having to enforce these policies.

The link to the game is here: http://www.bbc.co.uk/sn/hottopics/climatechange/climate_challenge/

A link to the background and description of the game is here: http://www.bbc.co.uk/sn/hottopics/climatechange/climate_challenge/aboutgame.shtml

Exploring the Ocean Floor with Nautilus Live

In our modern world of of GPS, when it seems like there is no frontier left, the ocean floor remains largely unexplored and unmapped. This website, hosted by National Geographic, follows the crew and scientists aboard the Nautilus. The crewmembers’ most recent mission was from June to November 2013 to explore the Gulf of Mexico and the Caribbean, mapping geological, biological, archaeological and chemical aspects of these areas to depths of about 2000 meters. Highlights of the trip included new discoveries of shipwrecks.

The beauty of this website is that it allows the general public- elementary school students, college professors and scientists, and average curious people- to connect with the crew. The website includes pictures from the missions, including this one of the bow of a shipwreck.

Additionally, the site provides videos of the ship’s robots, Hercules and Argus, at work, collecting samples thousands of feet below the surface. This is an image of Hercules using a temperature probe to test an underwater volcano:

The most interesting part of this website is that during missions, it connects directly to the crew aboard the ship. It shows a live video feed of the ship’s activities and allows students and the public to chat live with the Nautilus’s educators, who respond on an audio feed to students’ typed questions.

Finally, the site includes helpful links for teachers and kids, including interactive mapping and robotic design games to encourage and inspire future geographers to explore the ocean frontier.

http://www.nautiluslive.org/

GeoGuesser – Let’s Explore The World!

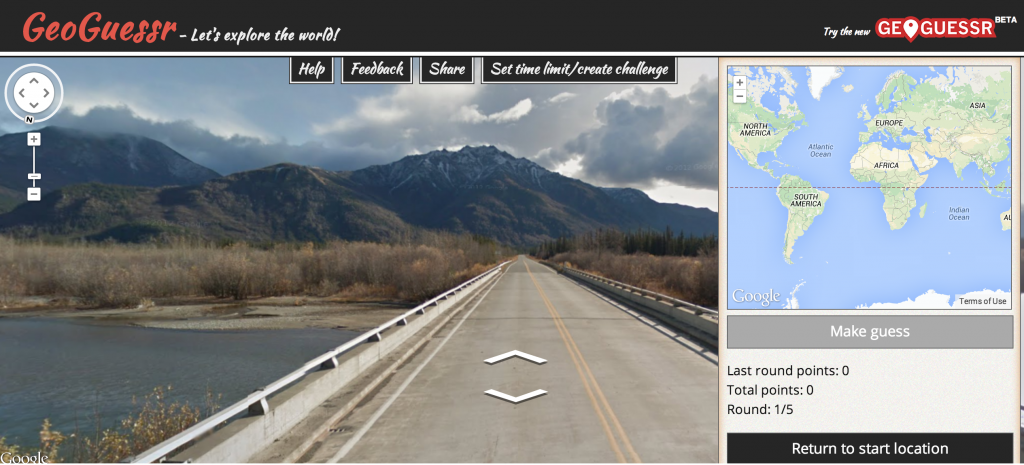
Use your knowledge of the lithosphere, pedosphere, and biosphere to guess where in the world these google map locations are!

Think you’re a geography expert? Test your knowledge with BBC Travel’s Geoguessr – the game that proves how well you know the world! As we explore the Lithosphere and Pedosphere and Biosphere check your skills against your knowledge. First, move around using your mouse and figure out where you are. Do you see some rich, red soil? What about volcanoes, palm trees, deserts, or oceans? Using your physical geography knowledge, try and guess where in the world you are located.Then click on the map in the lower right hand corner to place your marker (zoom in to increase your accuracy). When you’re sure, click the “make a guess” button, and find out how close you were!

Over 5 million miles of roads in street view by June 2012.

Unfortunately, because the site relies upon google maps, all locations will be along roadways limiting the world to just the 5 million miles of roads with street view images in over 39 countries.  Once you’ve mastered the basics, challenge my most recent score by clicking on this link. The world’s a huge place – get exploring and post your highest scores in the comments below!

Find out how close you were to each guess!

H-2-oh my gosh, that’s not a lot!

We all learned that Earth’s surface is 70% water in elementary school, but how much water is actually on Earth and what does it look like in comparison to Earth’s size? This drawing from the USGS shows the surprising answer: a pretty small volume relative to the entire globe.

Global water volume visual representation by the USGS

There are three blue spheres in the image laid over top of the North American continent that show, in order of decreasing size, all the water in, on and above the Earth; liquid freshwater in groundwater and small water bodies; and all the freshwater in lakes and streams which is where most of our water used every day comes from.

This website also describes the Earth’s water distribution in tables and graphs. The less than 4% of Earth’s water that is fresh is vital to humans around the globe and most of it is contained in glaciers and ice as well as underground.

In class, we’ve learned how the Earth is a generally closed system (with regard to matter) and that every aspect is related and dependent. This website definitely shows an understandable breakdown of where our water comes from and why every part is important. It also gives a great spatial representation of the water on Earth in comparison to the size of the Earth. I was actually surprised by the visual!

The Hidden Water We Use

The National Geographic website has several interactive activities, but one that I found particularly interesting was titled “The Hidden Water We Use,” which describes the amount of water embedded in objects we use everyday.  It describes how much water is used in each step of production of things like food and energy.

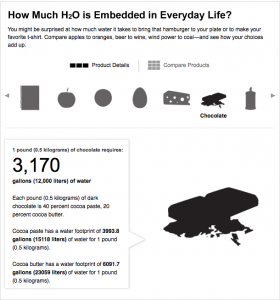
One that I found very surprising was the water used in producing 1 pound of chocolate – which I happen to eat a lot of! To make 1 pound of dark chocolate, 3,170 gallons of water are used. (3,993.8 gallons goes into making of 1 pound cocoa paste, and 6,091.7 gallons go into making 1 pound of cocoa butter!)


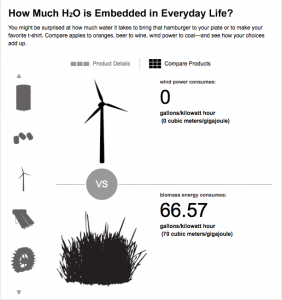
Another interesting part of this website was comparing products.  I compared wind energy and biomass energy and found that wind energy consumes no water, while biomass energy consumes 66.57 gallons of water per kilowatt hour.  Also interesting was that hydropower consumes 20.92 gallons of water per kilowatt hour and oil consumes 1.01 gallons of water per kilowatt hour.

There were also a few fun quizzes that I found, and realized I learned a lot of the information from class.  Try them out and see how well you can do!
.
http://environment.nationalgeographic.com/environment/freshwater/embedded-water/

Envision the James GeoStories

The Envision the James project is an online initiative to engage the community to make their voices heard pertaining to the James River. The project seeks to educate people but also learn what they would like to see happen along the James in terms of recreation, protection, and education. This is very important to helping people understand the geography of the James River and how it affects and is affected by humans.

The site also includes GeoStories, which are collections of pictures, videos, text, and audio that tell a story about a place. Several are already available on the website discussing several different areas along the James River. This is a great way to “remote sense” the river and learn more about it through other people’s experiences.

http://www.envisionthejames.org/about

National Geographic Global Water Footprint

National Geographic Global Water Footprint

This website is an interactive way to check your water footprint based upon what you consume. It shows where it comes from and how much water comes from certain areas for certain products. On this website you can also look at locations such as the Mississippi River Basin and see how much water is used and for what product in those areas.

This website allows us to understand and be aware of how much of the Earth’s water is being used for each of the common products we use every day such as coffee, corn, barley, cotton, grapes, cocoa, etc. It is important to understand how we are using our water and where that water is coming from. This is especially important because we know that less than 0.3% of our water on the earth is unfrozen fresh water. If we are unaware of how much is being used for the crops we produce and consume, it is possible that we could deplete these water sources quicker than we should be.

(From Kate Desai)

Water Cycle Activities

Image

The hydrosphere consists of the transformation and transportation of water throughout Earth’s spheres. This interactive site aims to challenge visitors on the stages of the water cycle. Then it explains the stages of the cycle which include evaporation, cloud formation, precipitation and water collection. All of these processes require the heat of the sun. This website would serve as a good studying tool for the hydrosphere.

http://player.discoveryeducation.com/views/hhView.cfm?guidAssetId=087777c8-4ff0-45d2-878f-e7cd90f7ee19

Forces of Nature

On the National Geographic website, I found an interactive and informative activity called Forces of Nature. Not only can you read up on tornadoes, volcanoes, hurricanes, and earthquakes, watch videos, view pictures, and learn about different case studies, but you can also improve your knowledge by causing a tornado, building a volcano, spinning off a hurricane, and setting off an earthquake. For example, to trigger an earthquake, you choose the ground type (bedrock, landfill, fault zone) that the building stands on, and the magnitude (low, high) of the earthquake, set it off, and see how the building responds to the earthquake. If a high magnitude earthquake occurs on a fault zone, for example, there will be significant displacement—sometimes the building may collapse partially or entirely. This earthquake activity in particular reminded me of our discussion in class about the Mercalli Scale that measures the damage the earthquake does. Check out all the Forces of Nature and play around with the conditions to create either a moderate or deadly disturbance.

http://environment.nationalgeographic.com/environment/natural-disasters/forces-of-nature/