“The Green Pope?” Religion and Science?

http://www.huffingtonpost.com/2011/11/27/pope-climate-change-conference-durban_n_1115016.html?ref=green

The pope and climate change? The church and the global climate? Religion and science? Are these all really coming together here??? You better believe it. Here we have an article talking about Pope Benedict XVI and his hopeful influence on the UN Climate Change Conference which starts today November 28, 2011! Delegates from nearly 200 countries are meeting to see what they can salvage from the wreckage of the Kyoto Protocol. That 1997 agreement aimed to cut greenhouse gas emissions from rich countries to an average of 5 percent below the levels they emitted in 1990.


A link is provided below to the actual conference website,

http://unfccc.int/meetings/durban_nov_2011/meeting/6245.php


The logo for the COP17 meetings in South Africa

The Pope’s greatest concern seems to be the poor and the future, “I hope that all members of the international community can agree on a responsible, credible and supportive response to this worrisome and complex phenomenon, keeping in mind the needs of the poorest populations and of future generations,” the pope said.

This has not been posted for any reasons of specific religion. This is simply to look at a rarely seen connection between religion and science that I saw as interesting and worth reading. The Huffington Post  provides many more articles and even videos and picture slides that deal with climate change and news and are worthy of looking into as well, while on the website.


Hobbit-holes, not just for hobbits anymore

Geoff Weathersby

http://www.simondale.net/house/

If you’re like me then a small part of you wants to live in the Shire. There’s something very settling about how hobbits live. Tolkien made them very communal beings that didn’t waste much. Everything they took they gave back, and then some. Last year, I was fumbling around on the internet and happened to find a group of people who made real-life habitable hobbit holes. Needless to say, I was instantly intrigued.

They guy behind it all is a man named Simon Dale and he calls his creations “low-impact woodland homes.” For Simon, it’s all about environmental sustainability. He says that we need to start taking real action to cut off our dependence on fossil fuels and he says we can do it by relying on land as we did before the industrial revolution. This, he says, is the answer to the climate change problem. We need to establish self-reliant local networks that operate both mentally and physically closer to the land. He writes, “Climate change is a clear imperative to curtail our fossil fuel use.” He suggests we do this by planting edible perennial food, eating less meat, using wood for fuel by setting up lots for rotational wood harvesting, and learning basic handiwork skills. By doing so, we will create communities sustainable within themselves that take a whole lot less from nature and replace a whole lot more.

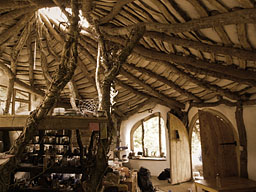
 To the left is a view from inside one of Simon’s low impact homes. It was made with a hammer, chainsaw and a chisle, cost 3,000 pounds, and took about 1500 man hours. It is 50 square meters in size, which is just under 550 square feet from our point of view. It is heated by a wood burning stove, gets water that flows down the hillside, is naturally lit by a skylight seen in the picture, and has solar panels that provide electricity. You can’t get much more sustainable than that.

I believe this has special relevancy for our class given our focus on the interplay between human life and our planet’s many systems. These low-impact homes, in a way, embody what I believe the take home message from our class to be. Earth is a closed system and we must plug into it. Burning fossil fuels, as well all know, is not a sustainable practice. As it is speculated that we have reached our oil peak, we all have to take a little responsibility in the quest for alternative energy. In the meantime, we need to look at how we’re currently living and examine how much we take that we don’t give back.  This is what drove Simon’s work and it needs to drive ours as well.

BBC Science and Environment

For years BBC news was the easiest and fastest source of world news for me. I usually use the Russian version of the website thought, which is slightly different. Recently, I discovered the Science and environment section on the BBC website.

EU climate commissioner Connie Hedegaard

This website is informative as a well as interactive. It has in the news story of the day. For example today  the main article on the page was Climate summit faces big emitters’ stalling tactics, it discussed the efforts of cutting GHG emissions by the nations. It showed that the debate about which countries should do what still continues even after the Kyoto protocol. According to the article developing countries will certainly target rich governments such as Japan, Canada and Russia over their refusal to commit to new emission cuts under the Kyoto Protocol, whose current targets expire at the end of next year. However, the article states that another main topic of the summit will be financial aid to the developing countries through Green Climate Fund, although it is not clear yet who exactly will provide the estimated funding of $10 billion dollars for the developing countries to reduce their GHG emissions. Developing countries say the public coffers of industrialized nations should be the main source, whereas industrialized world believes that private sector must be the primary source. At the end of the article the website provides links to previous articles related to the topic such as why did Copenhagen fail? I find that very useful, especially while starting doing research.

The main webpage of BBC science and environment has other unrelated stories below the main article, concerning different aspects of biosphere, hydrosphere, atmosphere and lithosphere. It also provides links to articles/ blogs by BBC experts on different topics. For example, I found one on marine reserves in Australia called Australia plans huge marine reserve in Coral Sea. The plan is to have fishing commercial and recreational allowed being only in some areas of the reserve, which at its closest point would start 60km (37 miles) from the coast and it extends out to 1,100km to protect the coral reefs.

The website also has great video and audio resources to keep the reader interested and save time. Videos and audios have related articles or text version below in case anyone was interested in keeping written record. Here is a video of an unusual formation beneath the ocean called Icicle of death.

Comment with your water footprint!!

By: Kyle Ragan

As we discussed in class earlier this year the United States has one of the highest water consumption rates in the world. Access to clean drinking water is already an issue to nearly one billion people around the world today. This number is only expected to grow as water may become one of the most fought over resources on earth. The issues around water use are both environmental and social. In class we mentioned the concept of virtual water. Virtual water takes into account your total water footprint for your daily life. While water usage may only take into account water that is consumed or used in your daily life. Virtual water also takes into account the water used to produce the food you eat and to transport this food to where you live. The first step to addressing the water problem facing the world is to better understand our own personal impact on global water.

The website H2o conserve provides tools for better understanding your own individual water usage. There is no perfect way to calculate an individual’s personal water footprint but H20 conserve provides a calculator that can estimate your individual water footprint. Use the calculator to calculate your water footprint. We can all look for ways that we can decrease our water consumption. The website also provides tips for ways that you can decrease your water usage.

We all have a role in helping the water crisis, take the first step and calculate your water usage and look up some tips about how to decrease your water footprint. Comment with your scores so that you can see how you compare with everyone else in the class.


What’s YOUR Ecological Footprint?

By Ruby Shumaker

Hey, everyone!

I’m sure you’ve all heard of the term “carbon footprint,” a measure of the amount of carbon emitted by an individual, an organization, or an activity. However, as I learned from a website from the Global Footprint Network, this footprint model is today often replaced by the Ecological Footprint as the major measure of humanity’s demand on nature.  The Global Footprint Network is a nonprofit organization established to enable a sustainable future on the Earth. The organization recognizes that in order to make this goal a reality, it is important to accurately measure human impact on the Earth to make more informed choices about our actions. For this reason, its mission is to accelerate the use of the Ecological Footprint, providing scientific data to drive large-scale, social change.

The site includes lots of great resources including information on the organization’s current programs and initiatives, links to each of its 90 partner organizations, a blog, and large sections detailing the components of an Ecological Footprint and the science behind it. When I first visited the site, I wanted to know the difference between an Ecological Footprint and a Carbon Footprint. So, I checked out the Carbon Footprint section of the site under the “Footprint Basics” tab. I found out that rather than measuring the amount of carbon emitted in tons, the Ecological Footprint translates the amount of carbon dioxide emitted into the amount of productive land and sea area required to sequester carbon dioxide emissions. This way, the Ecological Footprint shows us how our carbon emissions compare and interact with other elements of human demand, like our pressure on food sources and the amount of land we consume when we pave over it to build cities and roads. While the carbon component makes up 54% of humanity’s overall footprint and is the most rapidly growing component, the Ecological Footprint allows us to address the problem in a comprehensive way.

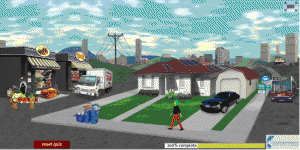
The Personal Footprint Quiz builds your environment as you answer questions about your lifestyle

There’s lots of information on the site about calculating Ecological Footprints for the world, for nations, for cities, and for businesses, but my favorite part of the site is the Personal Footprint Calculator. It’s a fun, interactive quiz (you even get to design an avatar!) that asks you questions about your lifestyle, such as how often you consume meat, how many miles you drive per week, and how often you recycle, to tell you how much land area it takes to support your lifestyle. At the end of the quiz, it lets you know how many Earth’s we’d need if everyone on the planet  lived your lifestyle (The Average American would require 5 Earths, I got 4), along with a breakdown of how much land you use in various areas of consumption. It also give you suggestions on how to reduce your Ecological Footprint. So, what’s your ecological footprint? Take the quiz and find out!

Nasa’s Climatological Website

Well, hello there gang!

If you ever happen to be looking for information or topics on large scale climate issues then look no further than Nasa’s climatological website. As soon as you visit the site’s homepage you see a wealth of information on a variety of climate issues. How about arctic sea ice levels? Yep, they have that. Carbon Dioxide information? Of course. Sea levels and global temperatures? You bet. How about land ice, do they do land ice? Most definitely.

There are also tabs on the homepage related to key indicators like carbon dioxide concentration, evidence like sea level rising, causes like greenhouse gases, effects like weather intensification, and uncertainties like the effects of solar output on Earth.  The tabs for each of these climatological phenomena are easily accessible in the event that any skeptics visit the site at any point. If you ever need to make an argument for the existence of climate change, this website is a fantastic place to start your research for such an arguement.

Perhaps the most persuasive and fascinating aspect of Nasa’s climate website is the wide selection they have of satellite imagery obtained by one of their three Earth orbiting satellites (called “Grace,” “AIRS,” and “Jason-1”) like this:

Of the images on the website, Nasa also has a wide array of photographs taken from people in the field like this:

Whether you’re doing research in order to debate against a climate change skeptic, for school, or for your own personal interest, Nasa’s climate website ought to be your first stop!

Science Daily

Hey everyone! It took me a while to decide on a geography related website to post in the blog. Ironically, the site I finally chose, sciencedaily.com, has been a favorite repository of random scientific facts and knowledge for a while now for both myself and my father (it is my dad’s homepage, so every time I use dad’s computer I am greeted with the latest interesting scientific news. My dad does not qualify as a scientist (he sells beer for a living), but every time he finds something cool on Science Daily he emails it to me. Like literally every time haha). Anyway, when you log on to Science Daily you immediately see the days top headlines in the scientific world. For example, today’s top stories include titles such as Ancient Stars Shed Light On the Milky Way, Whiskers: Milestone in Evolution of Mammals,  The Strange Rubbing Boulders of the Atacama, and Bats Can Rapidly Change Ear Shapes. Everytime that I log on I tend to unconsciously dedicate 15 to 20 minutes of my time sifting through novel discoveries.

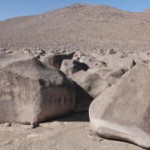
Today’s most interesting topic was about the unique boulders of the Atacama Desert, which ties in nicely with out recent study of the lithosphere and weathering processes. The large , smooth boulders found in the driest desert on earth were dislodged from hills surrounding the various basins located in the desert. Due to frequent seismic activity and earthquakes, the boulders, which have been in the basin for nearly 2 million years, rub against each other many times over the course of geologic time which creates their characteristic smooth sides. This process of weathering is extremely rare, and can only be found in areas of extremely low rainfall and high seismic activity, two conditions characteristic of the Atacama Desert. A picture of the boulders taken from the article is shown below.

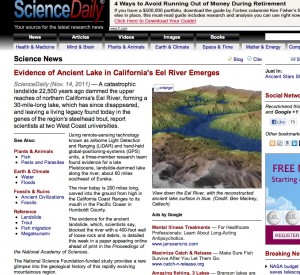
The website contains a lot of other cool features that allow you to find articles regarding specific topics. These topics vary temendously and include a myriad of topics associated with the atmosphere, hydrosphere, lithosphere and biosphere. For instance, one of today’s articles, titled Evidence of Ancient Lake in California’s Eel River Emerges, credits a past catastrophic landslide with the creation of a lake that affected, and still today affects, the gene’s of the region’s steelhead trout. It is a fascinating study that connects changes in the lithosphere and hydrosphere dictating changes in the biosphere. This article could be found under 3 different tabs (Plants & Animals, Earth & Climate, Fossils & Ruins), further proving the interconnectedness of the science of physical geography. Geography itself is a topic tagged in many of the posts, including an article about the spatial distribution of long-term carbon storage in the Ganges Basin. This website is really interesting, and like I said, if you spend a couple of minutes searching through the varying articles you are bound to learn something really interesting!


THE MOST INTERESTING BLOG EVER-PLEASE COMMENT!

About Project Noah: http://www.projectnoah.org/about

I came across the website through an advertisement on the National Geographic Website. Clicking on the link soon lead me to an interesting project that four NYU graduates have created. Entitled “Project Noah”, the experiment attempts to build a fun, location-based database mapping out wild-life intercations all around the world. The way Project Noah works is that anywhere at anytime, if you come across an organism, you take a picture of it, post it on the website, and attribute a location to where you spotted it. Oftentimes, members do not know the “official” names of the organisms that they take pictures of- but that is where the social networking aspect of Project Noah comes in. On the website, you can post and comment on the pictures by writing the name of the organism or general feelings toward the picture.

Another aspect of Project Noah is that it conveys the vast biodiversity around the world. With over 120,000 participants, and over millions of pictures uploaded, Project Noah serves as a catalog for speicies diversity and dispersion. Members can also participate in “missions”, which link all the classified organism pictures into a central location such as the National Saguaro Park. This helps scientists count and identify the certain species in the Park.

Project noah’s most notable feature is that it can be downloaded as an app, so pictures and categroizations can be uploaded easily and at any time. I see this whole project as a way to encourage people to reconnect with nature, documenting local wildlife, and creating “citizen-scientists”.

Banff Wildlife Crossings Project

This summer I visited Banff National Park in Alberta, Canada and we spent a lot of time driving on the Trans-Canada Highway. All along the TCH in Banff National Park, there are wildlife overpasses and underpasses that allow wildlife to safely cross the road without risking collision with vehicles on the road. I took a picture of one of the two overpasses currently in the park (it’s a little blurry). Having learned about habitat fragmentation and the importance of corridors in other classes, I decided to look more into this specific case.

The purpose of wildlife underpasses and overpasses is not only to protect the animals from the immediate risk of road mortality caused by park infrastructure, but also to help maintain a stable and diverse wildlife population. Because the Trans-Canada Highway is so large and heavily used, it has become a huge barrier for wildlife, which restricts their movement and habitat area, and eventually leads to a less diverse population because they are confined to a smaller habitat patch, and eventually can lead to extinction. Road mortality can also have an effect on a species’ population in a shorter amount of time (1-2 generations) than edge effects caused by the road. The project created is called The Banff Wildlife Crossings Project and was started in 1996.

In Banff National Park, they have created various measures of wildlife crossing structures in order to attempt to solve this problem. There are two wildlife overpasses that span 50-m wide over the highway. They monitored the effects of these wildlife over and underpasses for five years. From this they discovered that they have reduced all road-kill by 80%. As to determine the effect of the over and underpasses on reducing habitat fragmentation, a longer-term study is needed. However, overall the project has been a success.


Chesapeake Bay Shows Signs of Improving Health

Link: http://www.ens-newswire.com/ens/nov2011/2011-11-03-093.html

According to research being performed by scientists at Johns Hopkins University and the University of Maryland Center for Environmental Science, the efforts to clean up the Chesapeake Bay are proving successful.  Water samples compared to those over the last several decades show that the nation’s largest estuary is getting healthier in a sense.

This has come about as a result of reduction of the flow of fertilizers, waste, and other pollutants, which has in turn reduced the overall size of the oxygen-starved dead zones (uninhabitable areas for plants and animals) in the body of water.  Rebecca Murphy, who is part of the Department of Geography and Environmental Engineering at Johns Hopkins, believes that there is a direct correlation between the two occurrences, which seems a good sign for the future of the Chesapeake Bay and other vital water bodies.

The effort to clean up the bay really took hold in the 1980s with the federal Chesapeake Bay Program, which focused on restoring the previous condition of the water.  While this past year did not present the  best data regarding shrinking volume of dead zones, the overall trend in recent years has been positive in that these oxygen deprived areas have been decreasing.  Some scientists were concerned as there have been reports of early summer jumps in dead zone activity, but this has been shown to be a result of climate forces such as heavy rains, wind, salinity, and the sea level of the water.  If not for the efforts to decrease the flow of the contaminants into the Chesapeake Bay, the prevalence of the oxygen starved zones would surely have been worse.

IN SUMMARY: While overall climate change has been having negative effects on the Chesapeake Bay, localized monitoring and pollutant reduction has lessened the issues. Hooray for a positive (or at least less negative) development!