BBC – Climate Challenge

With scientists around the world gathering data in support of climate change accelerated by human factors, the BBC created a game to introduce some of the dilemmas this may present to governments around the world.  The goals of the interactive atmosphere is to give players awareness of what causes climate change, describe policy options available to governments, and give a sense of the challenges facing international climate change negotiators.

In this interactive game, you play as the president of the European United Nations, and you represent part of the Intergovernmental panel for climate change.  The game consists of ten turns, with each turn representing a decade.  In each turn, you choose up to six policies to enact during the decade, which impact the economic standing of the European nations, as well as energy, food, and water factors.  Some policies also have a positive or negative environmental impact, to reduce or cause more emissions linked to climate change.  Linked with these policies are popularity meters, based on how the public likes or dislikes the proposed policies – as the President of the European United Nations your job is to establish a strong policy on climate change while keeping the countries happy with your decisions and healthy so that they will continue to elect you to the intergovernmental panel for climate change.

The policies that you choose from in the game are based on actual governmental policy documents (except for those near the end of the game in more futuristic conditions).  The scale of the decisions and their impact was scaled back to a single turn for simplicity, and even with this simplistic model the game presents the player with good background knowledge on where policy makers may be having the most trouble meeting climate change requirements and ensuring cooperation with politicians from other governments.

When I played the Climate Challenge, I tried to meet every goal set for the climate reduction plan every 30 years (3 turns).  While I was effective in keeping my popularity up for the majority of the game and successfully meeting environmental and emission standards, sometimes my concern for the well being of the people in the European Nations wasn’t as high as it should have been. My results page showed scores of Environmental policy: 89% effectiveness; Wealth: 13% effectiveness; Popularity: 20% effectiveness.

The content of the game does a remarkable job of highlighting different consequences for potential actions, placing the player in the role of a politician fighting to recognize climate change and enact policies corresponding to their impact on reducing human impacts on climate change.  It is easy to get lost in the game, learning as you make policy decisions and seeing the potential impacts on the status of nations having to enforce these policies.

The link to the game is here: http://www.bbc.co.uk/sn/hottopics/climatechange/climate_challenge/

A link to the background and description of the game is here: http://www.bbc.co.uk/sn/hottopics/climatechange/climate_challenge/aboutgame.shtml

GeoGuesser – Let’s Explore The World!

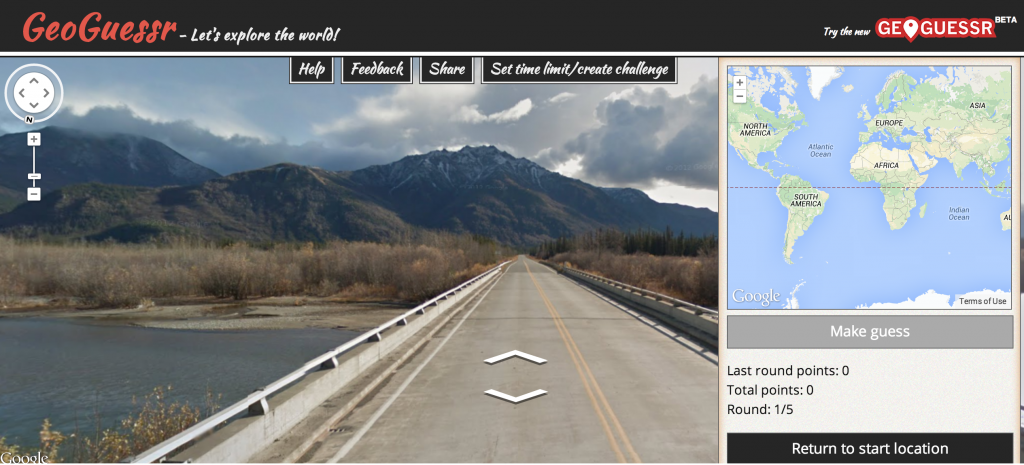
Use your knowledge of the lithosphere, pedosphere, and biosphere to guess where in the world these google map locations are!

Think you’re a geography expert? Test your knowledge with BBC Travel’s Geoguessr – the game that proves how well you know the world! As we explore the Lithosphere and Pedosphere and Biosphere check your skills against your knowledge. First, move around using your mouse and figure out where you are. Do you see some rich, red soil? What about volcanoes, palm trees, deserts, or oceans? Using your physical geography knowledge, try and guess where in the world you are located.Then click on the map in the lower right hand corner to place your marker (zoom in to increase your accuracy). When you’re sure, click the “make a guess” button, and find out how close you were!

Over 5 million miles of roads in street view by June 2012.

Unfortunately, because the site relies upon google maps, all locations will be along roadways limiting the world to just the 5 million miles of roads with street view images in over 39 countries.  Once you’ve mastered the basics, challenge my most recent score by clicking on this link. The world’s a huge place – get exploring and post your highest scores in the comments below!

Find out how close you were to each guess!

Breathing Earth—A Simulation of CO2 Emissions, Birthrates, and Death Rates

This website offers viewers an interesting and interactive way to conceptualize global CO2 emissions, as well as the birth and death rates of different geographical locations. The simulation uses statistical data for these different rates to provide general information about worldwide trends. The changing colors and the flashing dots and symbols explained in the key allow you to absorb the areas of highest CO2 emissions, as well as the highest birth and death rates by simply watching the map. As this simulation is interactive, you can also place your cursor on areas of the world that interest you to learn more about their specific rates. In the U.S., for example, one person dies every 12.1 seconds, one person is born every 7.4 seconds, and 1000 tons of CO2 are emitted every 5.3 seconds. If you click on a country, a box pops up suggesting useful climate change websites for that particular country, and on the bottom righthand side of the page, there is a box that shows how many tons, births, and deaths have occurred while you’ve been on the page.

Though we often hear or read statistics about increasing population and dangerous levels of CO2 emissions, this website applies these statistics to a world map, and thus allows us to visualize the areas in which these rates are the most problematic. By poking around on this page, I not only feel that I gained a slightly better sense of the the way these trends play out on a global scale, but I also found several other interesting websites about climate change that are specific to certain countries or areas of the world.

www.breathingearth.net

Earth and Moon Viewer

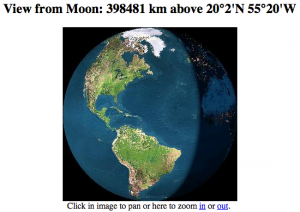
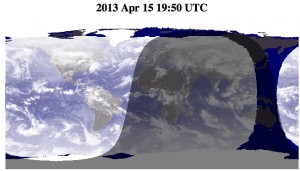
The Earth and Moon Viewer allows visitors to view either a real-time map of the Earth showing day and night regions, or view the Earth from the Sun, the Moon, the night side of the Earth, above any location on the planet that is specified by latitude, longitude, and altitude, from a satellite in Earth’s orbit, or above various cities around the globe.

There are many different viewing options of the Earth, which can be generated based on either a full-color image of the Earth by day and night, a topographical map of the Earth, up-to-date weather satellite imagery, a composite image of cloud cover superimposed on a map of the Earth, and several other features.

In addition to viewing the Earth, visitors can choose to view images of the Moon from the Earth, Sun, night side, or as a map showing day and night.

This website is really cool if you want to take a real-time look at all parts of the world and our moon as they constantly change!

http://www.fourmilab.ch/earthview/vplanet.html 

Forces of Nature

On the National Geographic website, I found an interactive and informative activity called Forces of Nature. Not only can you read up on tornadoes, volcanoes, hurricanes, and earthquakes, watch videos, view pictures, and learn about different case studies, but you can also improve your knowledge by causing a tornado, building a volcano, spinning off a hurricane, and setting off an earthquake. For example, to trigger an earthquake, you choose the ground type (bedrock, landfill, fault zone) that the building stands on, and the magnitude (low, high) of the earthquake, set it off, and see how the building responds to the earthquake. If a high magnitude earthquake occurs on a fault zone, for example, there will be significant displacement—sometimes the building may collapse partially or entirely. This earthquake activity in particular reminded me of our discussion in class about the Mercalli Scale that measures the damage the earthquake does. Check out all the Forces of Nature and play around with the conditions to create either a moderate or deadly disturbance.

http://environment.nationalgeographic.com/environment/natural-disasters/forces-of-nature/

Sea Temperature Rise

Rising sea temperatures is a great concern for our planet in the future. Although the ocean temperature does not warm or cool as dramatically as the land the ocean temperature has increased 0.18 Fahrenheit. This temperature increase may not seem severe but it has caused smaller organisms like krill to decrease in reproduction and has also caused coral to bleach, slowing their growing and making them susceptible to disease. The slow reproduction of krill causes a food shortage for many organisms that feed on them. The rising sea temperatures have also caused stronger storms. The warmer water temperatures create more water vapor, making it easier for storms to increase their size and intensity as they move over the warmer waters. In order to slow rising ocean temperatures we need to dramatically decrease our greenhouse gas emissions. Even if our carbon dioxide emissions level dropped to zero, the gases already present in the atmosphere would take decades before declining. This is a concerning problem that our generation will have to solve for our world to continue to function properly.

The Earth’s Atmosphere

While looking through geography websites, I found this one to be quite interesting because it is a nice, short summary about our atmosphere.

Although, it is a nice, short summary it does not get into much detail about the composition of the different layers of our atmosphere. Remember, the homosphere describes the layers of the atmosphere that are well-mixed (which include the mesosphere, stratosphere and troposphere) while the heterosphere includes the thermosphere and exosphere.
Also, the diagram leaves out the thermopause, which is the outerboundary of our atmosphere.

I thought this is a good review and fun, interactive template to learn about Earth’s atmosphere. Simultaneously, it is disconcerting that such vital pieces of information could be left out of an explanatory diagram that many people learn from.

Here’s the interactive template: Earth’s Atmosphere

You should explore the rest of the website as well!


Tornadoes- All the basics

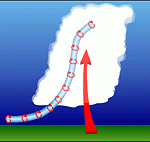
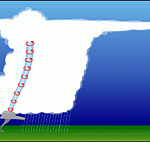
NOAA’s national severe storms laboratory calls tornadoes “nature’s most violent storm.”  These violent storms are defined as rotating columns of air extending from a thunderstorm to the ground, and occur more frequently in the United States east of the Rocky Mountains than in any other location worldwide.  From what causes tornadoes to protection measures, the NSSL has covered all the bases.  Tornadoes are developed from thunderstorms and emerge in advance of east-ward moving cold fronts.  Tornadoes form when a change in wind direction creates a horizontal spinning effect in the lower atmosphere, which is then tilted upward by rising air within the thunderstorm creating a column of rotating air.

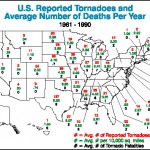
Tornadoes are often succeeded by another tornado, and therefore you rarely see a single tornado in the accompanying storm.  They have a wide range of occurrence including damaging outbreaks in the Carolinas, Pennsylvania/Ohio, and across the plains.  Tornadoes often occur in the afternoon; they can occur throughout the year, and have peak seasons depending on the location.  Some other dangers that often accompany tornadoes are lightning, flash floods, hail, and damaging straight-line winds.  Most recently, the tornadoes of March 2-3 occurring across the southeast U.S. and into the Ohio Valley region, were responsible for 41 deaths and was the second deadliest for early March in the U.S.’s history.  My own house experienced mild damage as a few windows were blown out due to the strong winds.  Some early warning signs of tornadoes include a dark, greenish sky, wall cloud, large hail, and a loud roar similar to a freight train.  Knowing these foretelling clues and staying alert to weather and news reports can help minimize lives lost due to these violent storms. The above image displays the yearly average number of tornadoes reported and the average number of deaths resulting from tornadoes by state.