Hurricane and Tropical Storm Tracker-Weather Underground

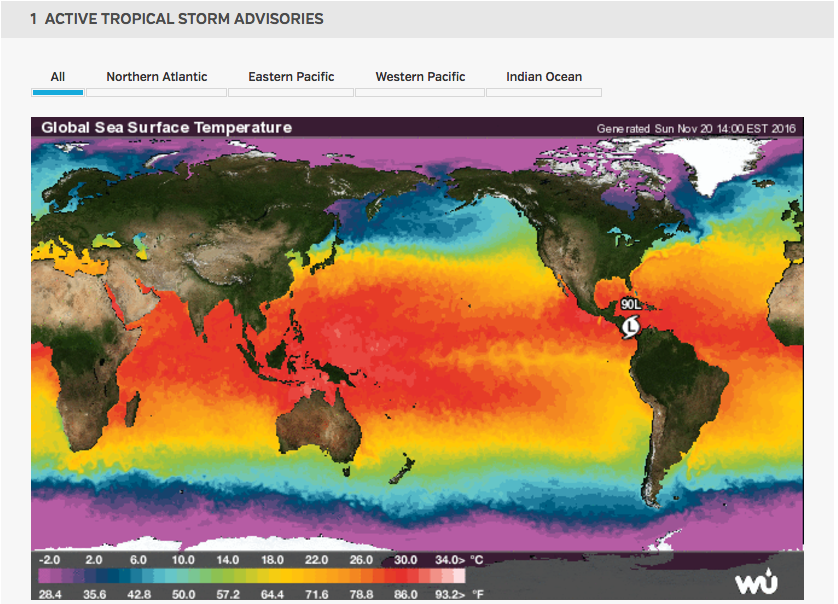
Weather Underground (https://www.wunderground.com/hurricane/atlantic/2016/Invest-90L?map=model), a weather forecasting website, has many different options for tracking weather systems around the world. The platform that stood out most to me was a global map that tracks hurricanes, tropical cyclones, and all active tropical storm advisories. This global map shows areas of low pressure and global sea surface temperatures. There is also satellite imagery and details of the specific storm activity in the North Atlantic, East Pacific, Western Pacific, Central Pacific, and Indian Ocean.

The most interesting part of Weather Underground is the archive that they have of past hurricanes and tropical storms. All previous storms year by year are listed and the maximum winds and minimum pressure are listed. For all previous storms you are also able to track them on a map of the ocean they occurred in.

Below is a picture of the active tropical storm advisories for Sunday, November 20th. We are able to see one low pressure area around South America.

Screen Shot 2016-11-20 at 2.06.58 PM

Personal Water Footprint Calculator: The Results May Surprise You

Have you ever wondered how much water you use? Even though the average American uses 100 gallons a day, the actual amount you use may vary greatly. National Geographic has created this interactive (and in my opinion, pretty entertaining) water footprint calculator. It can be found at:

http://environment.nationalgeographic.com/environment/freshwater/change-the-course/water-footprint-calculator/

This is a very thorough questionnaire. It start off by asking where your zip code, household size, year of your house, and what water using amenities you have in it such as sinks, toilets, showers. It even asks if any of them have been replaced recently to use less water. It then asks you about your usage habits of these and any other things you may have that use water such as a dishwasher.

It doesn’t just stop there. It asks you about your eating habits because it takes a lot of water to feed America whether it is to water livestock or plants. It then follows that with your energy usage, and finally, the things you buy (especially clothing and paper products). You’re able to see how your water consumption changes as you answer each question and you can see the average American usage statistic for each question.

At the end, it’ll tell you your usage summary. For me, I use less water, on average, in my home in Charlottesville, my food consumption, and the things I buy. However, I can reduce transportation and energy usage. I urge all of you to try this: it takes 5 minutes and you may be shocked at how much water you’re actually using.

This directly relates to the hydrosphere and human water consumption. Because we only have 0.3% of freshwater available to us, we need to be smart about our usage. Additionally, our water resources vary based on the area we live in so there may be an abundance or shortage if people are using water without having an idea of how much.

LiveScience

This website (LiveScience) does not just deal with geography topics specifically, as it offers a broad range of news sources and studies relating to a variety of scientific fields. Many of these stories relate to physical geography.  The website offers a variety of news stories, videos, and images concerning topics like health, space, and animals. The main tabs that I focused on covered “Planet Earth” and “Space.” The stories found on the “Planet Earth” included a large range of topics that we have discussed in class, such as the effects of global warming, access to freshwater, and the state of coral species who are reacting to warmer waters. The “Space” tab provided information such as the effects asteroids could have on Earth and Earth-size planets that could support life. All of these news stories are easy to read and include links to further scientific resources that could be used to learn more. Most stories are also accompanied by videos or photos to help illustrate the story.

LiveScience also shows the scientific topics of the day that are “trending,” such as global warming or military and spy technology. This site also offers links to other additional resources that relate to these scientific topics.

Overall, it is a helpful compilation of recent news stories that relate to a variety of scientific topics. They are fairly easy to read and can be understood by the general public. Based on our recent discussions in class, websites like these could be a helpful link to bridging the gap between the scientific community and the public on matters like global warming.

To visit the site: http://www.livescience.com/.

Water Cycle Activities

Image

The hydrosphere consists of the transformation and transportation of water throughout Earth’s spheres. This interactive site aims to challenge visitors on the stages of the water cycle. Then it explains the stages of the cycle which include evaporation, cloud formation, precipitation and water collection. All of these processes require the heat of the sun. This website would serve as a good studying tool for the hydrosphere.

http://player.discoveryeducation.com/views/hhView.cfm?guidAssetId=087777c8-4ff0-45d2-878f-e7cd90f7ee19