
The U.S. Geological Survey displays information relating to recent earthquake strikes around the world. The left side of the screen shows the recent earthquakes in the United States. It tells how many earthquakes have occurred in the map are over the last 24 hours. If you zoom out to the entire world, the panel adjusts to include earthquakes all over the world. On the map, each earthquake is represented by a circle with varying sizes and colors. The size of the circle represents the magnitude of the earthquake and the color represents the relative age of the earthquake. The plate boundaries are are outlined in red. Clicking on a specific earthquake takes you to another page that offers an interactive map, a regional information map, a seismicity map, and a shake map. Also, people can write up a felt report of their earthquake experience. Additionally, under settings tab, one can narrow or widen the earthquake parameters by size, time, and place.
This website is helpful for understanding where recent earthquakes struck and specific information about each earthquake. Earthquake map visualization helps to reveal patterns in earthquake behavior and helps educate others on the overall impact of earthquakes.
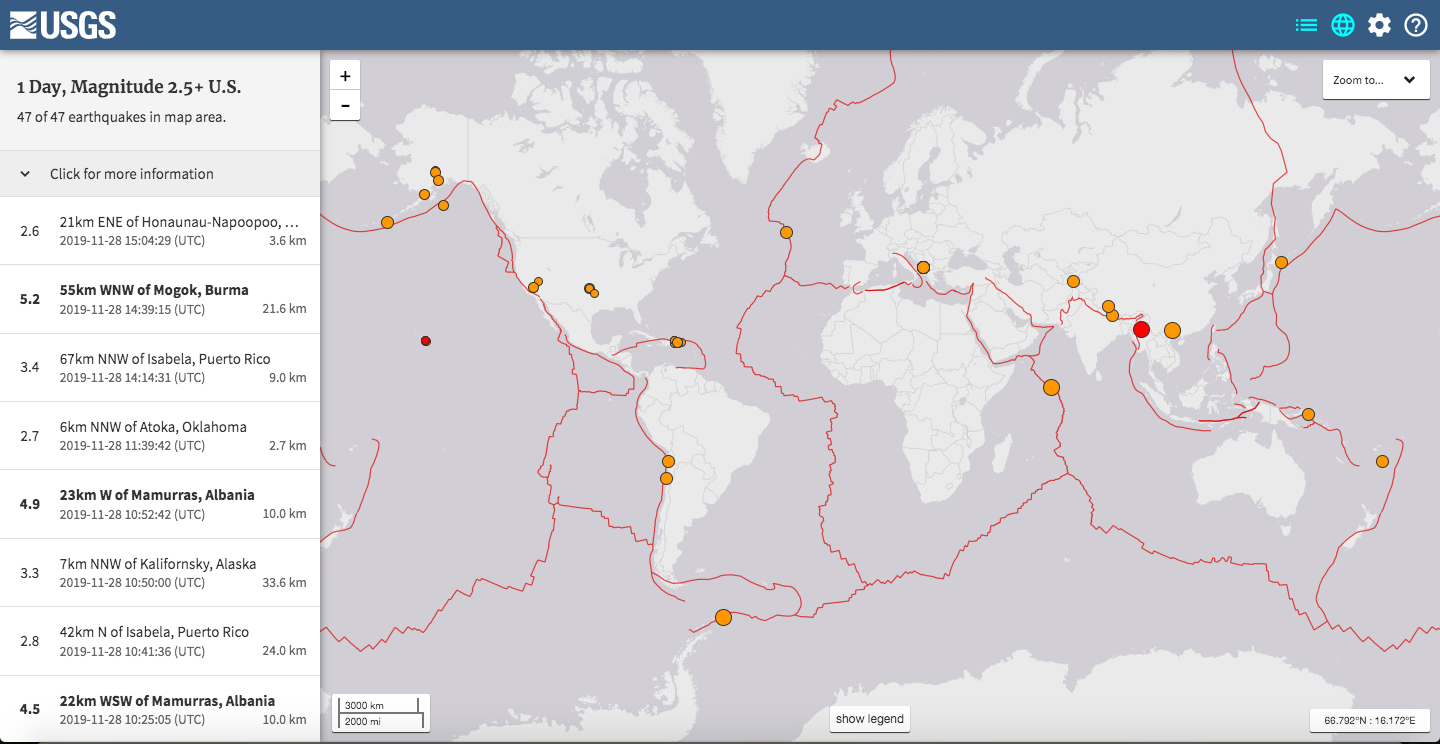
https://earthquake.usgs.gov/earthquakes/map/