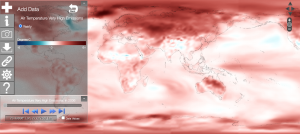
NOAA View is a data exploration tool produced by the National Oceanic and Atmospheric Administration (NOAA) and developed by the NOAA Environmental Visualization Laboratory. This interactive map contains over 100 different datasets on a wide range of topics related to the Earth system: ocean, atmosphere, land, cryosphere, climate, and weather models. On the left, click at “Menu” and then “Add Data” to select the dataset to visualize. At the lower left corner, click at “Time” and drag the button to see how data change by time. Users can also click on areas of interest for more detailed information.
I found this an awesome website because of the enormous amount of data available to visualize. For example, under “climate”, we can choose to look to “observations” or “simulations”. I really like the “simulation” tool as we can simulate how ocean/air temperature, precipitation, or sea ice concentration change under low, moderate, high, or very high emissions.

