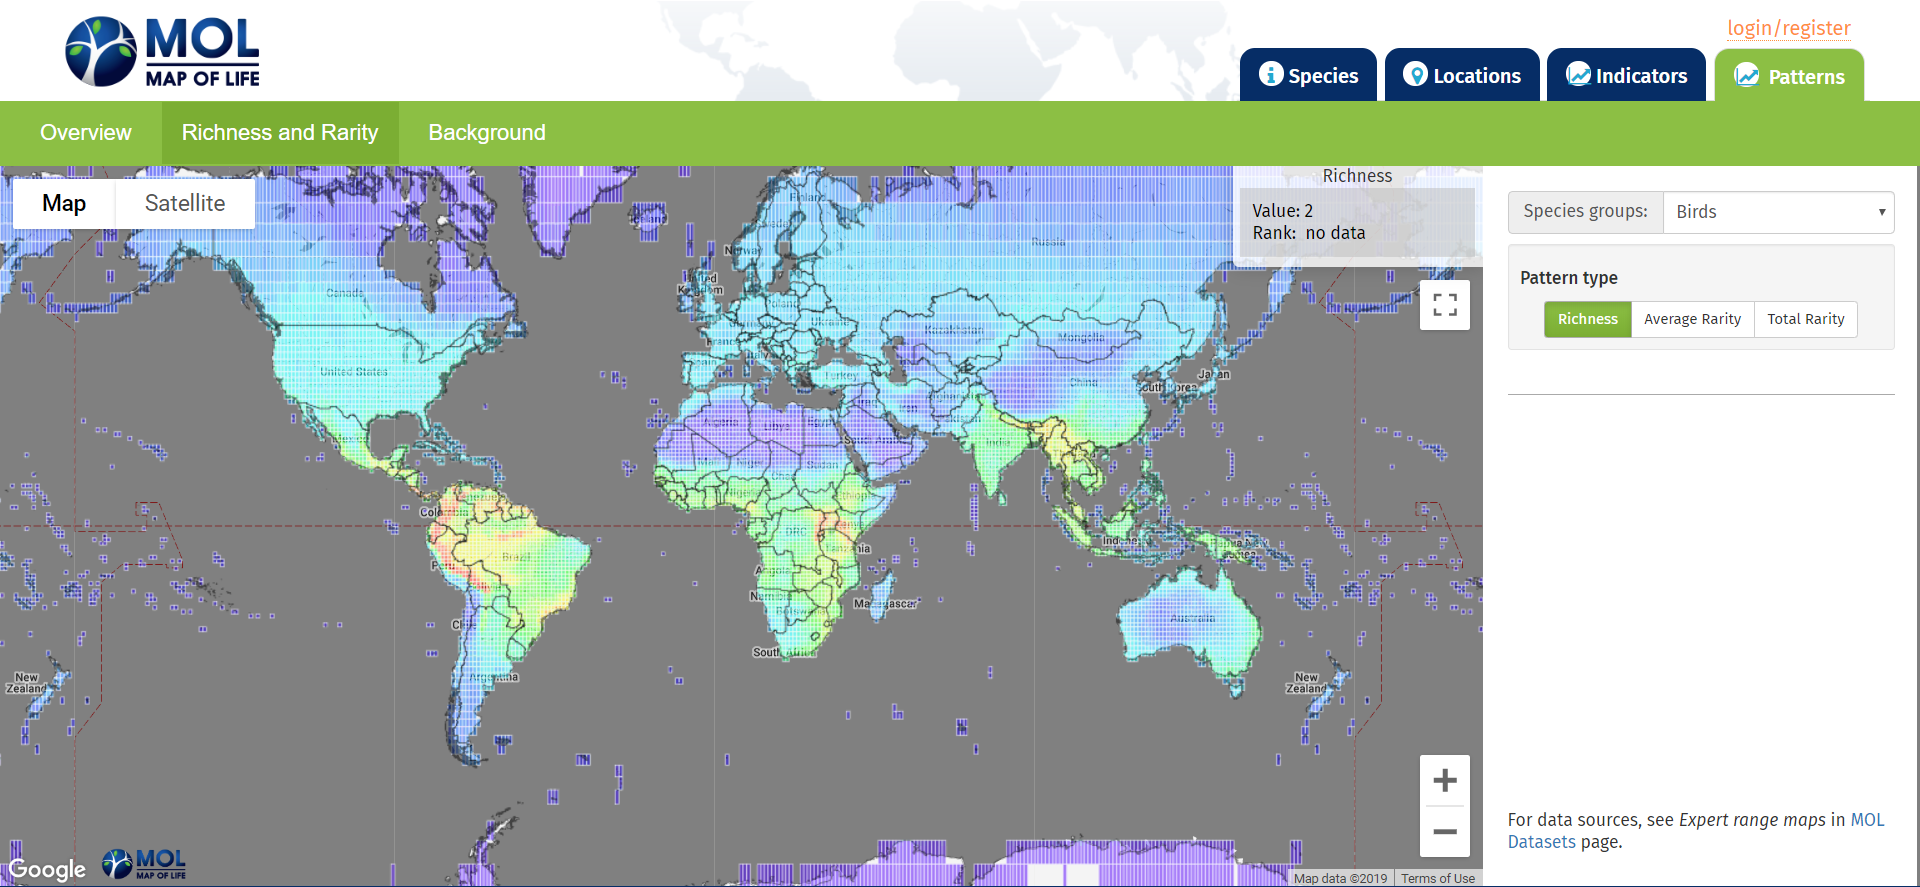
This website, the Map of Life (MOL.org), has provided an interactive map that shows species richness and species rarity across the world, showing data on the biosphere. It using a spread of colors to symbolize the different values, with purple being the least rich or rare, and red being the most. The map has three different screens: one for richness, one for average rarity, and one for total rarity. Additionally, you can click between a map view and a satellite imagery view. The map allows you to zoom in and out to see variances between regions at a large and small scale. The map also allows you to pick groups of organisms, with categories such as vertebrates, invertebrates, and plants. Within these categories are subcategory to get more specific.
Here is an image of the map feature:
URL: https://mol.org/patterns/richnessrarity?taxa=birds&indicator=sr

