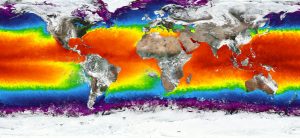
Interested in visualizing how the earth has changed over time in terms of sea temperature, air quality, or flood hazard? NASA’s interactive website, Worldview, uses satellite imagery taken over the past 40+ years to help communities visualize the changes that have taken place over time.
Worldview was created using NASA’s Earth Observing System Data and Information System (EOSDIS) to create 800 satellite imagery layers, allowing individuals to view time-stamped changes in critical focus areas such as wildfire management, volcanic eruptions, tropical storms, and more. Layers are categorized based on topic, as shown below. Users can even view layers based on ‘Science Disciplines’– which separates layers into categories such as Atmosphere, Biosphere, etc.
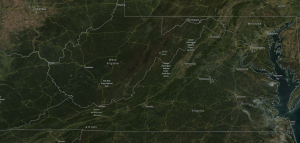
Worldview also allows users to interpret data using different scales! While global data may be valuable for some users, others may benefit from more smaller, more localized scales. Worldview’s zoom capabilities allow users to visualize data from the scale that meets their individual need!
Check out Worldview yourself: https://worldview.earthdata.nasa.gov


