The 10 Fastest Growing & Declining Airports in the U.S.

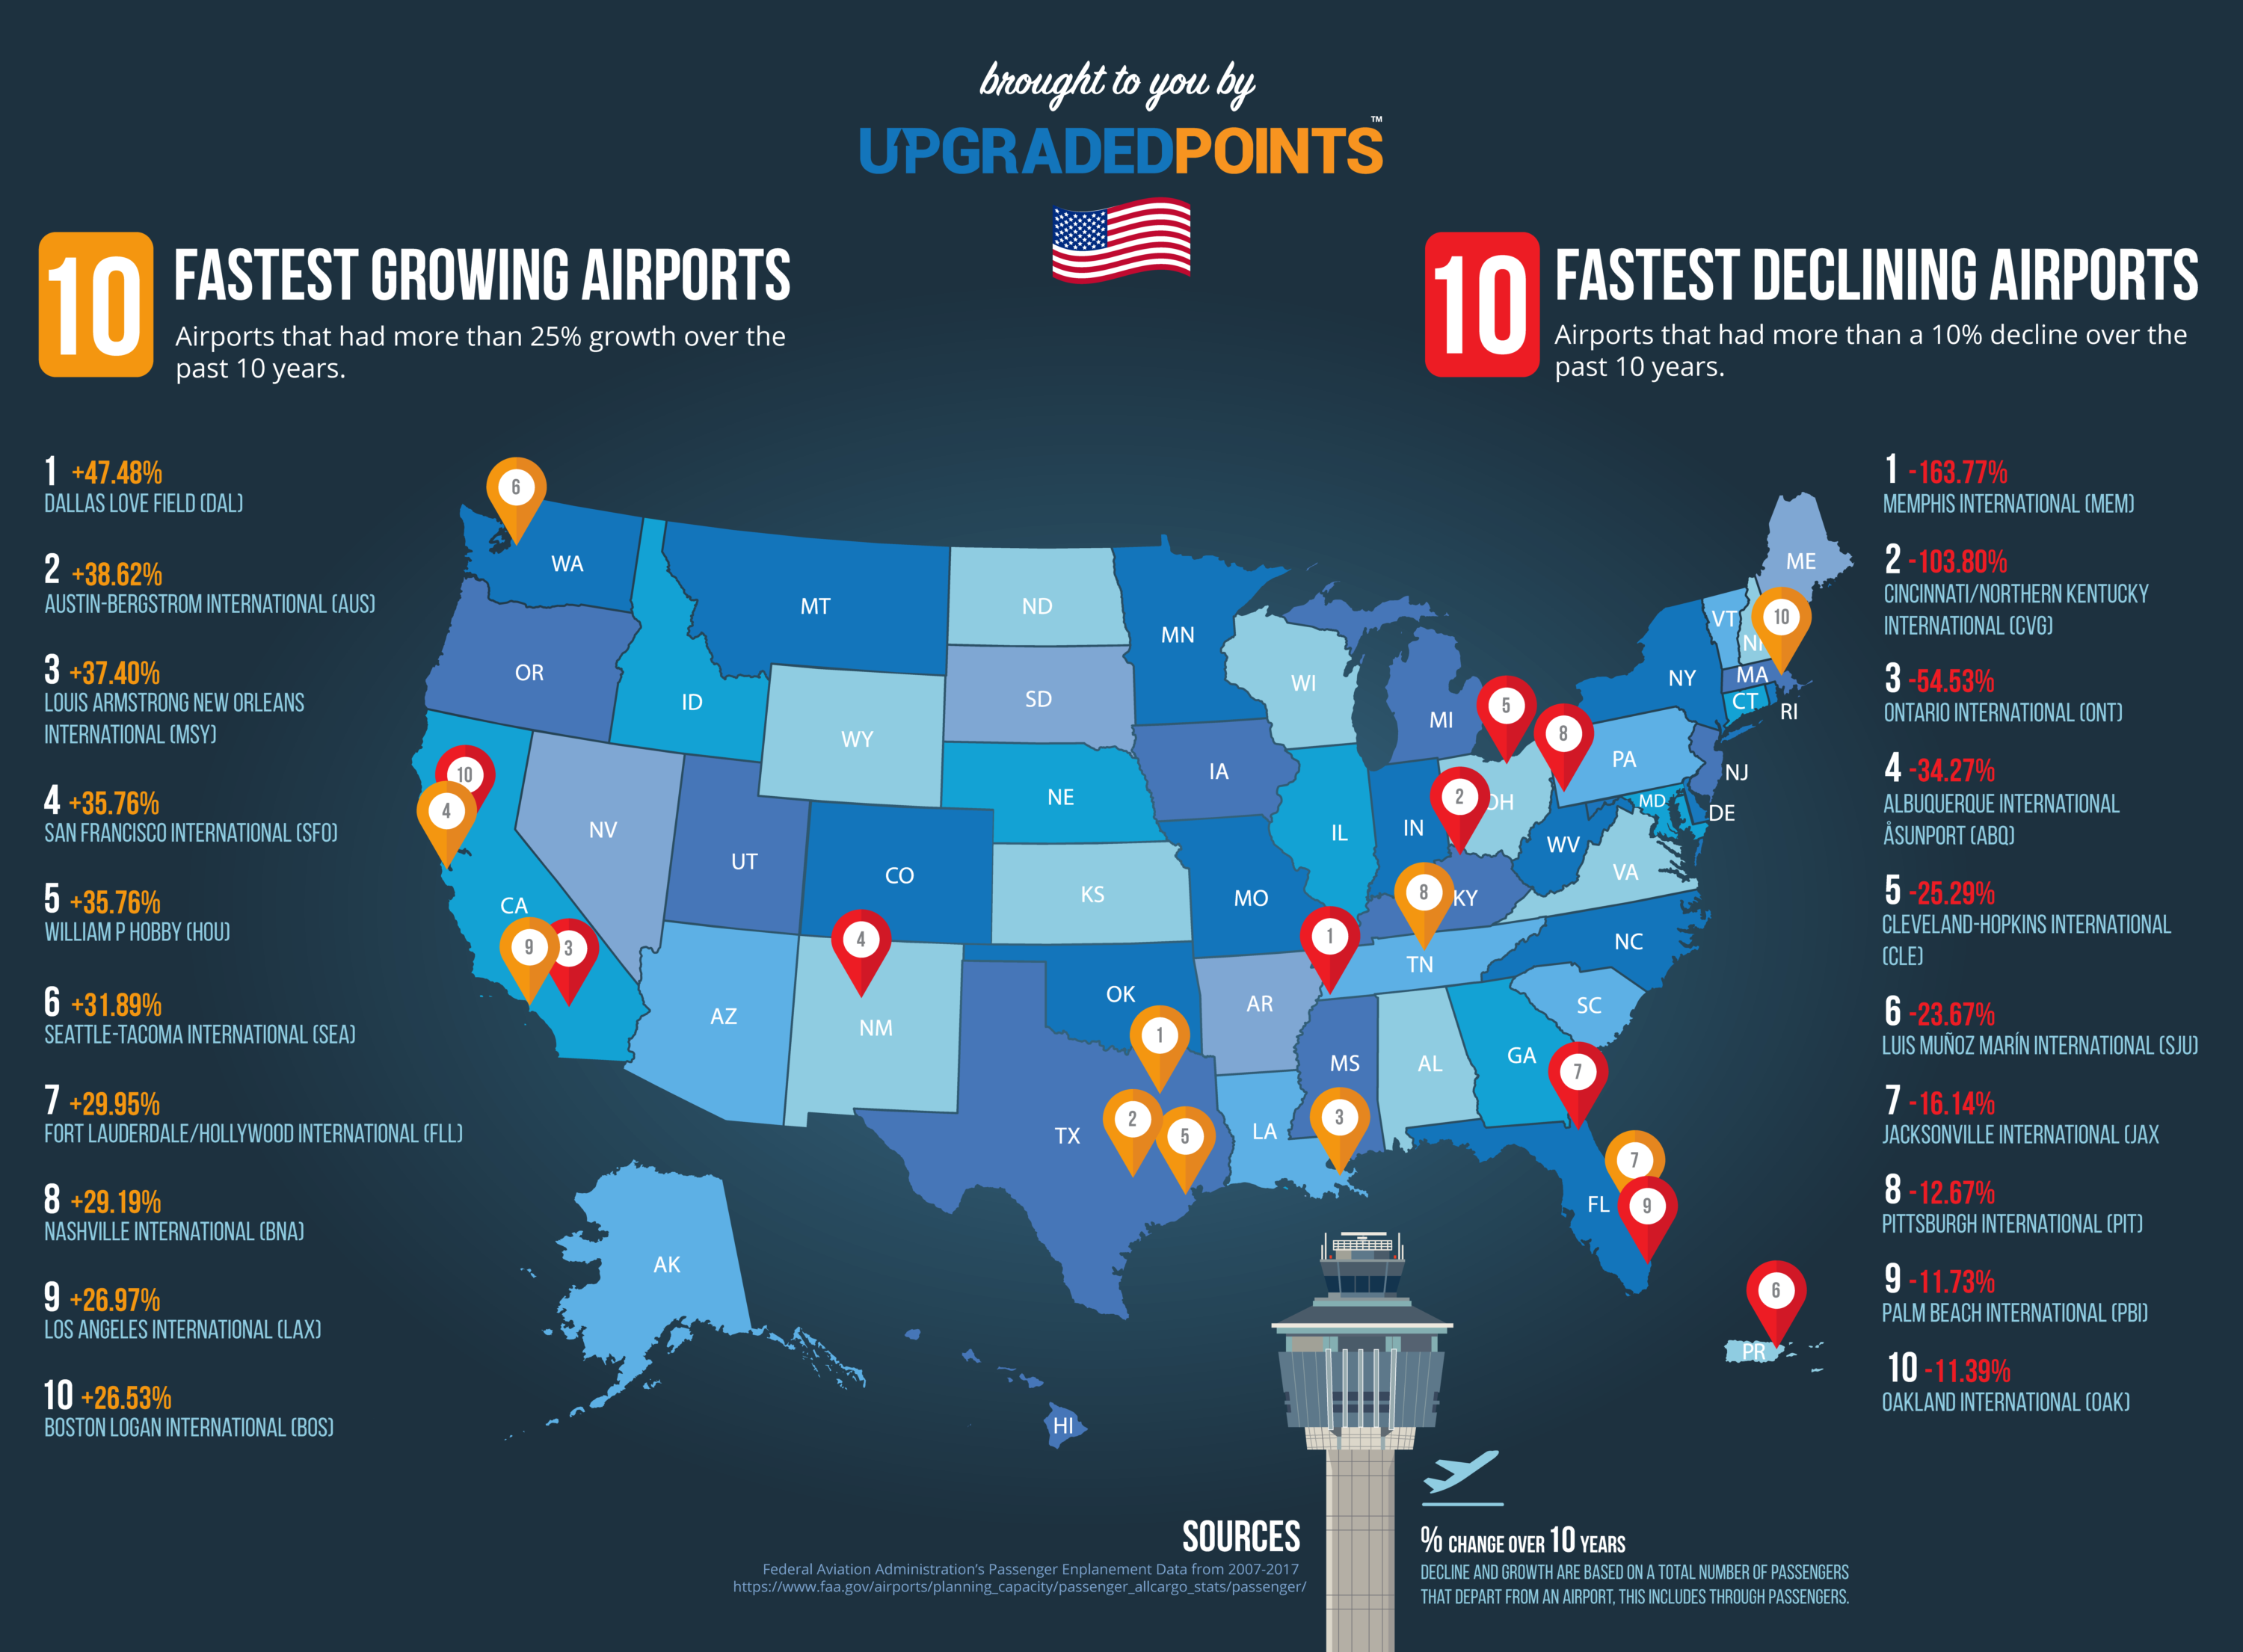
If you have ever been anywhere in the United States then chances are that you’ve been to one of these airports marked on the map above. With over 3.7 million square miles of sights and sounds to see, the United States and its 50 states to visit have become quite an attractive tourist destination. The airline industry marks the most popular means of long-distance travel in the United States, as traveling by car is often an arduous task, and the United States has failed to advance high-speed trains as a viable option.This map from Upgradedpoints.com depicts the top 10 fastest growing airports in the United States, along with the top 10 fastest declining airports in the United States. The map is based on data collected from the Federal Aviation Administration(FAA), from the years 2007-2017. The criteria to be counted for the study is that the airport must exhibit over 3 million passengers in foot traffic a year, which categorizes it as a midsize airport in the United States.

The map representing the top 10 fastest growing airports, and the top 10 fastest declining airports in the United States, is a fairly basic map. It is easy for the average viewer to interpret the map and recite the main points of it, as on either side of the map there is a bulleted list either representing the category growing or declining. These lists are clearly labeled 1-10 and give the name of the airport and its location with either the percentage the airport has grown in passenger traffic or the percentage it has decreased in passenger traffic. For example, Dallas Love Field airport in Dallas, Texas is number one on the fastest-growing list, and it has grown 90.39% over the 10 years. The information from the lists is then taken and pinpointed on the map of the United States for where that airport is located. The map makes it clear that airports that grew are represented by an orange pin on the map, whereas airports that decreased are represented by a red pin. 

While looking at the map, something I found to be interesting has to deal with the location of the airports. The majority of the locations of the airports that are decreasing are further away from the coast and more inland in the United States. This is compared to the growing airports which are mainly cities in states that aren’t deadlocked. Based on this observation and further observing the map one could infer where trends of Americans are traveling and which cities are most popular. Destinations such as Austin, Texas, and Nashville, Tennessee are perfect examples of popular destinations that are on the growth list. These cities have gained large popularity for people to move to and visit. As effective as the map is in telling the story of US airports, a critique that I have, which is a major silence of the map, is that the map offers no explanation as to why the specific airports made their respective categories, and leave the viewer to infer on their own. I believe that the map can include a brief sentence or two below each airport to explain,which will strengthen the overall map. These sentences may include reasonings such as an airline hub was relocated here or moved from here showing its increase or decrease. In addition, another possible reason could be that the airport is either newly renovated or needs major renovations causing it to decline. 

In 1978 President Jimmy Carter introduced the airline deregulation act which offers an explanation to the major silence of this map. Before this act, the airline industry was heavily regulated by the Civil Aeronautics Board(CAB). The CAB controlled where flights can fly to and from for each airport, along with what the price was for the ticket is allowed to be, and much more. In addition, before 1978 the airline industry was monopolized by a few players, but the new law promoted more startup airlines into the business.This gave way to new players in the market who operated out of new hubs. Airline hubs also mark a major player in the increase and decrease of airports as before 1978 hubs didn’t exist. For example American airlines up until 1978 operated flights to 36 destinations, after 1978 it created a large hub at the Dallas airport in which it operates flights to over 100 different destinations from Dallas. With the deregulation of the airline industry, we’ve also seen more competition between the airlines which has a direct impact on the map. Airlines want to move their hubs to the hottest markets and even the markets of their opponents to try and steer profits away from opponents. (Singh)

Provided the proper background information to the map, along with a brief explanation included on the map, the map will be stronger than it already is. Though the average viewer can already infer the main points of the map, there is still a whole story to be told of this fascinating industry that the map silences. The airline industry will indeed continue to be the most popular method of long-distance travel in the United States for years to come. It’ll be intriguing to see the differences on the map during the next 10 years, as this industry is always evolving for the better. 


Works cited:

Rodriguez, C. (2021, April 26). The 10 fastest growing & Declining airports in the U.s. [data-driven study]. UpgradedPoints.com. Retrieved September 17, 2021, from https://upgradedpoints.com/travel/airports/fastest-growing-and-declining-us-airports-in-the-us/. 

Singh, S. (2020, July 31). How the airline Deregulation Act shook up US AVIATION. SimpleFlying. Retrieved September 17, 2021, from https://simpleflying.com/airline-deregulation-united-states/. 


Posted in Uncategorized | 3 Comments

Atlas of The Week: The Atlas of Food

The Atlas of Food from the University of California Press makes a great choice for atlas of the week for our class. I found this atlas to be a great choice, as with every map there is a story that goes way deeper than anything you could see on the map. Food is very interesting when it comes to this, as depending on whether a country is developed, developing, or undeveloped the food will be completely different in all of these scenarios leading the viewer to gain knowledge. This has been a heavy focus in class, understanding the significance of the map and what it implies, which is why this atlas has a lot to teach us.  

Blog of The Week: 

Link:https://adventuresinmapping.com

Posted in Uncategorized | Comments Off on Atlas of The Week: The Atlas of Food

Atlas of the Week: The Apiaries

Theapiaries.com is an atlas of comprehensive maps of apiary permits on public land in the United States. The United States Bureau of Land Management (USBLM) grants apiary permits on public lands, and when they publicly list these permits, the data can be overwhelming. Theapiaries.com processes and analyzes this data into total permits, authorized permits, pending permits, closed permits, expired permits, cancelled permits, withdrawn permits, and rejected permits, and then plots all the permits on a map of the United States. This is a great resource if you are interested in detailed interactive maps of apiaries and active beekeeping areas.

Posted in Uncategorized | Comments Off on Atlas of the Week: The Apiaries

Humoristische Karte von Europa im Jahre 1914

At first glance, the Humoristische Karte von Europa im Jahre 1914 is a rough portrayal of the European continent. Upon second look, the country boundaries morph to vaguely resemble human and animal representations. After several more scans over the map can it realize its true form as overt political World War I propaganda.

Even though the human personification of continents and countries can be seen for centuries predating World War I, human and animal metaphors on maps peaked in Europe between 1845 and 1945 with political animated cartoon maps. The increase in prevalence of these satirical maps reflected the significant political and cultural changes that occurred during the time. Political figures were caricaturized, and European nations were assigned symbolic identities that provided humor and accessibility to the geographical map and international relations at the time. This unique political caricature map of Europe illustrates the continent at the commencement of World War I. The map was made by Karl Lehmann-Dumont in Dresden, and shows the Germans’ position on the alliance and territorial disputes towards the end of the first year of World War I. The countries involved in the war are represented by human and animal caricatures with various objects that help illustrate the state of Europe during the war.

This map is relatively entertaining propaganda from early in the war that was employed to ridicule and stereotype the opposition. Political cartoons such as these were produced by both sides and neutral entities. Each country is depicted in a captivating and relatively lighthearted manner, as this map was made fairly early in the war, before many deaths. Germany is extending and spreading himself with all his might, stoutly defending his homeland by already grasping the Frenchman by his throat and punching the Russian bear. The country’s Imperial Eagle unleashes bees from its hive to attack its enemies, which appear on the map as both bees and missiles. France, already confused and covered in bees, appears to retreat, and calls to England for help. The Russian has an “Angel of Peace” emblem on his hat, with a bottle of alcohol in his left hand and a whip of “revolution” in his right hand. The nasty, voracious giant Russia opens its mouth wide, attempting to swallow Germany and Austria, but is dissuaded by the German bees. England stands on bags of money while being punched in the face by an iron fist, alluding to centuries old grievance that England could afford to pay other countries to fight wars, causing political and social instability without risking British lives by intervening on the continent in a major way. The English bulldog finds it difficult to breathe with a snake wrapped around its neck. The Englishman also seems to be dragging Japan into the war by holding a string that is attached to Japan depicted in an inset on the left side of the map. Lehmann-Dumont particularly seems to criticize Slavic peoples in the Balkan Peninsula. Bulgaria is depicted as a mini-Russia, washing its saber, still bloody from the Balkan War, while Serbia as a swine is hunched over caught by both ears by the Austrian double-eagle, as the country which ignited the world war with its murder-bomb, and Montenegro as a louse, foolishly fighting against Germany and Austria-Hungary and ecstatically getting Russian rubles for doing so. Numerous other complex relations and symbolic references fill the map.

Obviously, the countries being depicted in Lehmann-Dumont’s map are far more culturally complex than the biased stereotypes they are being reduced to. Lehmann-Dumont made this map from a German point of view, which explains the vilification of Russia and the mockery of Great Britain, as well as the inclination towards Germany and the approval of Austria-Hungary. Setting a fixed image of a nation or generalizing about an entire country is unfair, even if it is for the sake of humor or satire. Stereotypes do not account for the fact that nations and its citizens are individually complex, with each one possessing a unique constellation of personal attributes. Geopolitically, stereotyping dehumanizes people, and places all members of a group into one homogeneous category, often solely because of the actions of a powerful leader or influential group.

All maps contain some sort of message about the world and the areas they depict. They are inherently arguments, however, due to the nature of maps, they are often interpreted as fact and reality, when this is not the case. The mapmaker tries to induce the reader to believe in the completeness of the information, and he does so by critiquing (or at least satirizing) all the nations on the map, all in an attempt to prove the truth and reliability of the map. While Lehmann-Dumont is German, Germany is still shown to be brash and expansive, perhaps to show Germany’s responsibility in the outbreak of World War 1. Karl Lehmann-Dumont’s cartoonist, satirical style of his Humoristische Karte Von Europa im Jahre 1914 allows the viewer of the map to consume it not from a scientific standpoint, so the viewer can realize the bias and messages the map portrays. This experience is what Lehmann-Dumont intended. Interpreting the map as current events, as well as art makes the messaging more palatable to the viewer and the directed audience of the political cartoon.

Works Cited

Lehmann-Dumont, Karl. “Humoristische Karte Von Europa Im Jahre 1914.” Cornell University Library Digital Collections, Cornell University, 25 Aug. 2015, digital.library.cornell.edu/catalog/ss:3293872.

Peacay. “Dogs of War: Satirical Maps of the First World War.” BibliOdyssey, 3 Aug. 2008, bibliodyssey.blogspot.com/2008/08/dogs-of-war.html.


Posted in Maps of the Week | 1 Comment

Richest Billionaires in Every State in 2021

     In 2020, the COVID-19 pandemic began and an economy like never before came from it. Unemployment drastically rose, many large and small businesses closed, and others struggled to stay open. However, during the mass unemployment and bankruptcy people and businesses endured, stocks were at their record highs and companies like Amazon and Tesla along with technology companies thrived. The gap between the wealthy and poor has greatly increased since the beginning of the COVID-19 pandemic. This map from HowMuch.net specifically shows the wealthiest billionaire in every U.S. state in 2021, hinting at the inequality in our country when it comes to wealth.

     HowMuch.net’s website’s ultimate goal is to teach people how to understand money, whether it is taxes, debt, insurance, stocks, or loans. There are tons of other maps and graphs that explain and help visualize each of these subjects. For the map I chose to discuss, because the focus is only on the wealthiest billionaire in each U.S. state, the map is only of the fifty states. The map is very straightforward. A state is a dark navy blue if their richest billionaire has a net worth of 100 billion or more and the color gets lighter and lighter according to how rich the richest billionaire is. If a state does not have a billionaire then the state is colored a light gray. There are only seven states that are not home to any billionaires: Alaska, New Mexico, North Dakota, Alabama, Vermont, New Hampshire, and Delaware. There is a legend at the top of the map that displays this. Also, in each state that has a billionaire, the map displays a portrait of its richest billionaire and next to it is their name and their net worth. The map does not offer much information after that. I believe the map could have included descriptions at the bottom about why each person is as wealthy as they are, along with the billionaire’s name, net worth, and where they live. This could be seen as a silence of the map. 

     Jeff Bezos is not only the wealthiest person in the state of Washington, but he’s also the wealthiest person in the world. Ever since the COVID-19 pandemic started, people have been less likely to go outside. Rather than going to physical stores to shop, people would choose to shop online because it is “safer” and easier. Much of the online shopping would take place on Jeff Bezos’ Amazon. Bezos is the founder and CEO of Amazon, and because of the major increase and dependency of online shopping in the past year, his net worth has almost doubled since the start of the pandemic. His net worth was estimated at $113 billion at the start of the pandemic and is currently estimated over $192 billion. Bezos is not the only billionaire who has benefited during the pandemic as the net worth of Tesla and SpaceX’s CEO Elon Musk has grown over 500%. His net worth at the beginning of the pandemic was an estimated $24.6 billion and is now estimated at over $166 billion. During the making of the map, Musk’s net worth was estimated at a whopping $191 billion and for a short period of time he surpassed Jeff Bezos’ net worth to claim the title as the richest man in the world. The demand for electric vehicles surged along with Tesla’s stock price. It blew up this past January taking part in its total increase of 900% over the past year. His net worth has clearly gone down from $191 billion, but the value he lost does not compare to his value gained. 

     Another tech guru that experienced a large increase in their wealth was Facebook’s co-founder and CEO, Mark Zuckerberg. Because COVID-19 made it harder and less likely for friends and family to get together, Facebook allowed those to stay connected in the safest way. The 2020 U.S. presidential election was also a popular topic on Facebook with everyone sharing articles and videos. From the combination of more users and the stock price of Facebook increasing almost 100%, Zuckerberg’s estimated net worth rose from roughly $55 billion to over $100 billion in the past year. The background and stories behind how Jeff Bezos, Elon Musk, and Mark Zuckerberg’s estimated net worth grew tremendously during the pandemic are just some examples of what the map could have added to create a better understanding of today’s wealth inequality. Although after analyzing the map and doing more research to prove the inequality in today’s wealth worked, this map is both effective and ineffective at the same time. It completes its goal in showing the wealthiest billionaire in every U.S. state in 2021, but it lacks the sense of a deeper meaning. It does not try and imply that we need to try and solve the gap between the wealthy and poor that has greatly increased since the beginning of the COVID-19 pandemic. 

Sources:

https://howmuch.net/articles/richest-billionaire-in-every-state-2021

https://www.usatoday.com/story/money/2020/12/01/american-billionaires-that-got-richer-during-covid/43205617/

https://www.cnbc.com/2021/01/07/elon-musk-is-now-the-richest-person-in-the-world-passing-jeff-bezos-.html

Posted in Uncategorized | Comments Off on Richest Billionaires in Every State in 2021

Atlas of the Week – Beginner’s World Atlas

National Geographic’s Beginner’s World Atlas aims to get kids interested in geography! This atlas is great for children. The bright colors and design draw kids in. Typically, atlases can be somewhat complex. While children can look at the images inside a typical atlas, they might be a little hard to understand. The Beginner’s World Atlas is perfect for kids ages 5-8. This atlas is a great resource for children. 

Posted in Uncategorized | Comments Off on Atlas of the Week – Beginner’s World Atlas

Atlanta’s Traffic Infrastructure

Have you ever spent the night in a big city and the sounds of traffic kept you up at night? In 2019, Atlanta, Georgia ranked number ten in a list of cities in the United States with the worst traffic congestion. This map, from the US Department of transportation documents the amount of noise due to traffic in the city of Atlanta. This map encapsulates the sound from cars, trains, and planes. As a major city, it is pretty predictable that Atlanta would host a fair amount of traffic. Atlanta hosts a population of 488,800 so it is not all that surprising that a lot of drivers would be on the highways in Atlanta daily. 

This map from the United States Department of Transportation is a pretty basic map. It outlines the major roadways around Atlanta and labels the names of surrounding towns. The areas with the highest noise levels are highlighted in red. As the noise lessens in certain areas the colors fade to orange and then to yellow. This particular map has no legend, so the viewer is left to assume general noise levels based on the colors used in the map. From this map, the viewer can easily assume that noise levels in Atlanta are high due to the large amounts of red highlighting in the city and its surrounding areas. This is not surprising due to the fact that Atlanta is a cosmopolitan city with a midsized population. However, this map does not offer any explanation as to why Atlanta has such large noise levels due to traffic. I believe this is a huge silence of this map. 

Traffic in Atlanta has a surprisingly large amount to do with the history of segregation in the city. During much of the nation’s history, the attempts to separate the races are inescapably “spatial” in addition to the socio-political and economic segregation that is so familiar in American history. In fact, the spatial and social aspects of segregation are intertwined. This pattern is very true for the city of Atlanta. During the New Deal, federal agencies pushed Black Americans into ghettos by labeling neighborhoods as risky investments or good investments. This would lead banks to only distribute loans to people living in neighborhoods that were labeled as good investments. Therefore, people who lived in the “risky” neighborhoods, often Black people, would not be able to take out a loan and could not advance their living situations. This practice is called redlining. Redlining led to the creation of very distinct and segregated neighborhoods. During the 1950s and 1960s, the federal government funded the creation of a new interstate highway. While the federal government funded the large majority of this major project, local governments had most of the say in how the highways were laid out in each state. In Atlanta, these highways were placed on routes that would lead to the destruction of the “riskier” Black neighborhoods. This was a common practice in other Southern cities like Richmond, Nashville, and New Orleans. Not only were these major highways used to destroy minority neighborhoods, but they were also created as a physical barrier between white and minority neighborhoods. This trend can be seen in cities across the East Coast. 

If you follow the paths of major highways in these cities, you can see the stark division between neighborhoods. By following the path of these highways, you can also see that they often do not follow a very direct path. This is due to the intentional, racist layout of many major highways. The circuitous routes that city planners designed for these major highways now cause major traffic jams in big cities. By looking at this map of traffic sounds in Atlanta, we can clearly see that the city is full of traffic. However, this map doesn’t give any historical context as to why traffic in Atlanta is so heavy. The map is also not detailed enough, for the viewer to be able to see the pattern in traffic sounds without any prior knowledge. Although the viewer can see that the city of Atlanta has a high volume of traffic sounds, the viewer cannot see which neighborhoods are specifically impacted. I believe this lack of historical context to be a large silence of this map from the United States Department of Transportation.

Given the proper historical context, this map has the potential to be interesting and meaningful. But, given the way this map is presented right now, it would be fairly meaningless to the average viewer. This map from the Department of Transportation is silencing a very important, and often overlooked, piece of American history. The map of noise due to traffic in the city of Atlanta, Georgia has the chance to be powerful, but the creators of the map have silenced a large part of its power.  


Work Cited

Kahn, Michael. “Map Reveals Noise of Atlanta’s Transportation Infrastructure.” Curbed Atlanta, 27 Mar. 2017, https://atlanta.curbed.com/2017/3/27/15065666/atlanta-airport-noise-neighborhoods-interstate-traffic.

Kruse, Kevin M. “How Segregation Caused Your Traffic Jam.” The New York Times, 14 Aug. 2019. NYTimes.com, https://www.nytimes.com/interactive/2019/08/14/magazine/traffic-atlanta-segregation.html, 


Posted in Uncategorized | 3 Comments

Blog and atlas links

Cartographic and Architectural Records at the National Archives in College Park, MD | National Archives– This is the blog link I have chosen. I think it is really cool how it contains all different maps of different times of California from many different eras, as well as many other writings and documents to go along with the times of these maps that can give context and other interesting events during these times.

Atlas of the Historical Geography of the United States (richmond.edu)– this is the atlas link that I have chosen. I find this atlas incredible interesting because it shows the geography of the united states and how it has been split up by votes in each presidential election for about 100 years. And with this atlas, on the side it gives a lot of context and material about each part of this atlas and for each election.

Posted in Uncategorized | Comments Off on Blog and atlas links

Piri Reis- map that could change the world


The Piri Reis

When people talk about controversy regarding maps, there is no conversation that is able to be had without bringing up the map, the Piri Reis. This map has been around since the age of great geographical discoveries, from the 15th to 17th century and was created in 1513. Some researchers that have studied this map see it as evidence on old research of the Antarctic coast before the era of Great Geographical Discoveries. This leads to much controversy and different theories about this map since there is no actual evidence supporting the claim by these researchers.  This map has caused much commotion since the moment it was discovered, (Tchakarov pg. 1).

A German theologian by the name of Gustav Adolf was the man who discovered it on October 9,1929. He was hired by the Turkish Ministry of Education to catalog different works and findings. When he discovered the map, he realized that he could be holding a unique and important piece, and gave it to an orientalist named Paul Calais, who identified the map as Piri Reis. After that, this map became a sensation because it was the only known map of the world that was “discovered by Christopher Columbus”. As we now know this is untrue, but at the time this is the land that they thought Columbus had gone to. Also, it was the only map to that date that showed South America in its correct longitudinal position to Africa. What they found was only a fragment of the entire map, and due to the damage, some of the dimensions are fragmented, but some numbers were able to be seen, so they were able to interpret it, (Tchakarov pg.1). In the legend of the map, it is said that using twenty graphics, and mappae mundi, which is the maps of the world, Piri Reis assembled this map. These maps included eight Ptolemaic maps, an Arabic map of India, four newly drawn Portuguese maps of Sindh, Pakistan, and a map of the lands that Christopher Columbus had supposedly discovered. This map is currently being kept in the library of Topkapi Palace in Istanbul but is not often shown to the public.

The biggest controversy and overall confusion regarding this map is the fact that it could possibly depict Antarctica 300 years before the southern polar continent was discovered, (Tchakarov pg 2.). The other, even more outlandish statement is that Antarctica is shown as it was before it was covered with an ice cap, which was more than 6,000 years ago, (Ancient Code pg. 2).  There are several anomalies that do not match the timeline that this map would have been created. One of them is that it uses the Mercator projection. The Mercator projection is a cylindrical map projection that shows north as up and sound as down while preserving local directions and shapes. While this projection was created in the mid 1500’s, since this map was drawn and signed in 1513, it causes confusion due to this projection being used over 50 years before its alleged creation. The other large anomaly is the inclusion of Antarctica without its ice cap. Studies done by a college professor, Charles Hapgood, and his class from New Hampshire College concluded that to have this kind of depiction and description, this map would have had to have been based on sources from 4,000 BCE. What is more is that to have this kind of topographic representation of the area inland of the coast, one would have had to have aerial capabilities in addition to normal abilities, which is unheard of at a time so long before any sort of realization into airborne capabilities,(Tchakarov pg 3). There is still no proof proving or disproving that the Piri Reis map shows Antarctica or not. If people believe it is Antarctica, then it is conceivable that some ancient civilization must have had advanced navigational skills that would be centuries ahead of their time. The other more sensible idea is that it is a depiction of the lower coast of South America, which is the more probable idea, but no one knows for sure yet. However, either way, with the use of the Mercator projection years in advance of its “founding” and the orientation of this map cause it to be unique and one of the most talked about maps from the great discovery This map presents a lot of historical context that calls into question a lot of different events from the past, but the one thing that comes to my mind when looking at the background and description of this map is that it can show that even though advancement in maps and technology happens with time and more and more progress, this map can show there were people or there were maps that can show this advancement much before the time it was told to have happened. Especially like the Mercator projection and how this map used it almost half a century before it was so-called created, it is interesting to see how no matter what the era, or where in the world, there can always be new findings and new developments in the making of maps.

This map also calls into question the ideas of politics a bit with the usage of Christopher Columbus in this map. As we all know now, Columbus landed in North America and called it the New World. But back then people thought he landed in the West Indies and and the places that are regarded too in this map. So, when people looked at this map and defined some of these places as the land discovered from Christopher Columbus, it could cause some political controversy because many may not like that in the present. Especially with some of the backlash that Columbus is getting in the United States now due to what he did to the natives already living in the New World, some may take offense to being called the land that Columbus discovered like these lands are called in this map. It just shows that there is always a political and historical side to each map that is created, especially ones that stem as far back as the Piri Reis.


Citations

Tchakarov, Vladislav. Most Controversial Map in History; What Secrets Does the Piri Reis Map Hold? 3 Nov. 2020, curiosmos.com/most-controversial-map-in-history-what-secrets-does-the-piri-reis-map-hold/.

Team, Ancient Code. “Before Antarctica Was Covered in Ice-Someone Mapped It with Extreme Precision.” Ancient Code, 27 Feb. 2018, www.ancient-code.com/antarctica-covered-ice-someone-mapped-extreme-precision/.


Posted in Uncategorized | 3 Comments

Atlas of the Week-The African-American Atlas

The Atlas of the week The African-American Atlas is very relevant to our class and to the University of Richmond. This Atlas chronicles significant points in African-American history that have influenced African Americans’ perspectives, lives, and aspirations today. This well-balanced account of the complex African-American society and its people who suffered and continue to struggle is presented in this extensively illustrated reference book, which spans the beginnings of Africa to the transatlantic migration, from slavery to the Civil Rights Movement. This connects to our class because the past couple of weeks we have been giving light to black cartographers and looking at their maps. While also the University of Richmond students have been removing names associated with racism from dorm buildings.

Posted in Atlases of the Week | Comments Off on Atlas of the Week-The African-American Atlas