
Map of the Week, Provided by the Central Intelligence Agency
Mexico’s Chronic Water Crisis
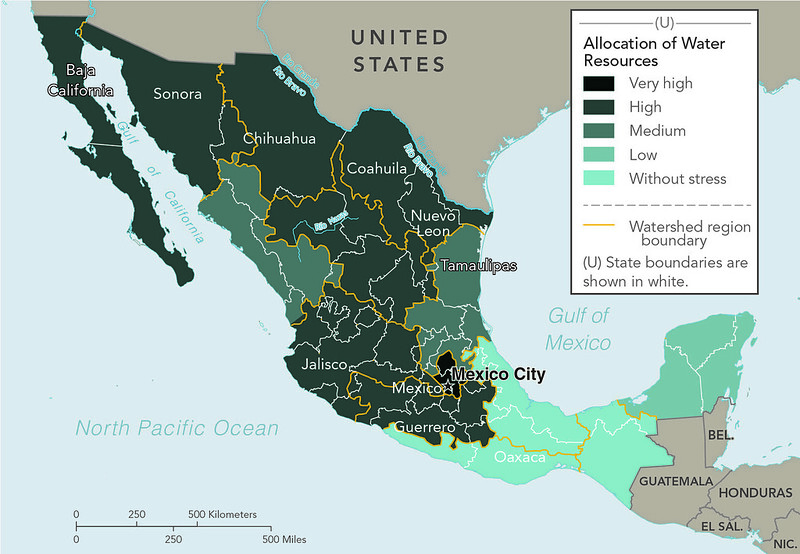
62% of Mexico’s municipalities face dangerous water shortages (newyorktimes.org). 73 Million Mexicans, 57% of the population, lack access to clean drinking water. Additionally, Mexico consumes the most water bottles per capita than any other country in the world (water.com). The United Mexican States, with a population of over 128 million people (worldometer.org), possesses a very diverse geographic landscape; the country’s geographical diversity ranges from the great Sonoran and Chihuahuan Deserts to the northwest, to lush green rainforests and nature preserves with sub humid climates in the south near the borders of Guatemala and Belize. Even with their diverse geography however, Mexico is suffering from an extreme water shortage that is affecting the entire population, hitting low-income citizens the most. As seen on the Map of the Week above provided by The Central Intelligence Agency, Most of Mexico’s states, as well as the capital Mexico City face concerningly high amounts of water allocation for their citizens.
It is interesting that the Central Intelligence agency chose to make such a detailed map of their neighbor down south. It could be that because both Mexico and the southern United States are currently suffering the consequences of a powerful drought, understanding the effect the drought has on Mexico can give American intelligence to have a better idea on how the United States may be affected.
Throughout Mexico, but especially in its densely populated cities such as Mexico City and Monterrey, government-sanctioned water-delivery trucks known as pipas will deliver water to parched neighborhoods, where residents fill the largest container they own with water to carry back home. Some families only receive water from the pipas once a week (newyorktimes.org).
Because of government regulations, large factories are able to acquire all the water necessary for operation. But for the Average Mexican, or even the wealthy Mexican, their needs for water allocation are secondary in the eyes of the government. This harsh reality, plus the unfortunate circumstances for residents is the perfect recipe for political unrest to brew. Beyond the numerous accounts of pipas being stoned, there are instances of locals threatening to kidnap drivers if they do not go off their scheduled driving route to deliver water to thirsty neighborhoods. (newyorktimes.org).
Another reason that has led to Mexico’s chronic water crisis is climate change and unexpected changes in water patterns. Global warming and climate change have led to less rain in Mexico. In the state of Nuevo Leon in the northwest that shares a small border with Texas, the rainfall only amassed to 10% of the monthly average recorded since 1960’s (newyorktimes.org). On the Map of the Week, Nuevo Leon falls into the High Category for water allocation, which is the same for every other Mexican state that shares a border with the United States.
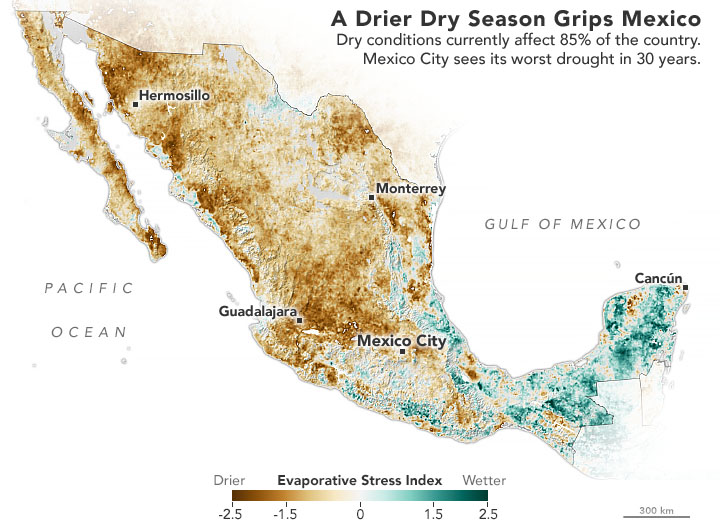
Scientists are certain that global warming is at least partially responsible for the ongoing drought that has plagued Mexico as well as the southwestern United States for years. Satellite Data from the NASA Earth Observatory report that about 85% of the entire country is impacted by droughts (earthobservatory.nasa.gov). The Villa Victoria Reservoir in the State of Mexico, the state surrounding the capital city is filled to about a third of its capacity, as of March 2021. The satellite images also show the rate of evapotranspiration, the amount of water that is evaporating from the ground as well as local vegetation. The map shows that most of the country ranges anywhere from 0.5 to 2.5 times drier than normal evapotranspiration levels (earthobservatory.nasa.gov.).
When it comes to actually looking at the Map of the Week, the regions that are highlighted to have the most stressed water allocation also happen to line up with the regions of Mexico that face either a dry or very dry climate on a climate map (mexicochannel.net). States in the southern part of the country, such as Tabasco and Oaxaca, are rather humid and do not face as severe a water shortage.
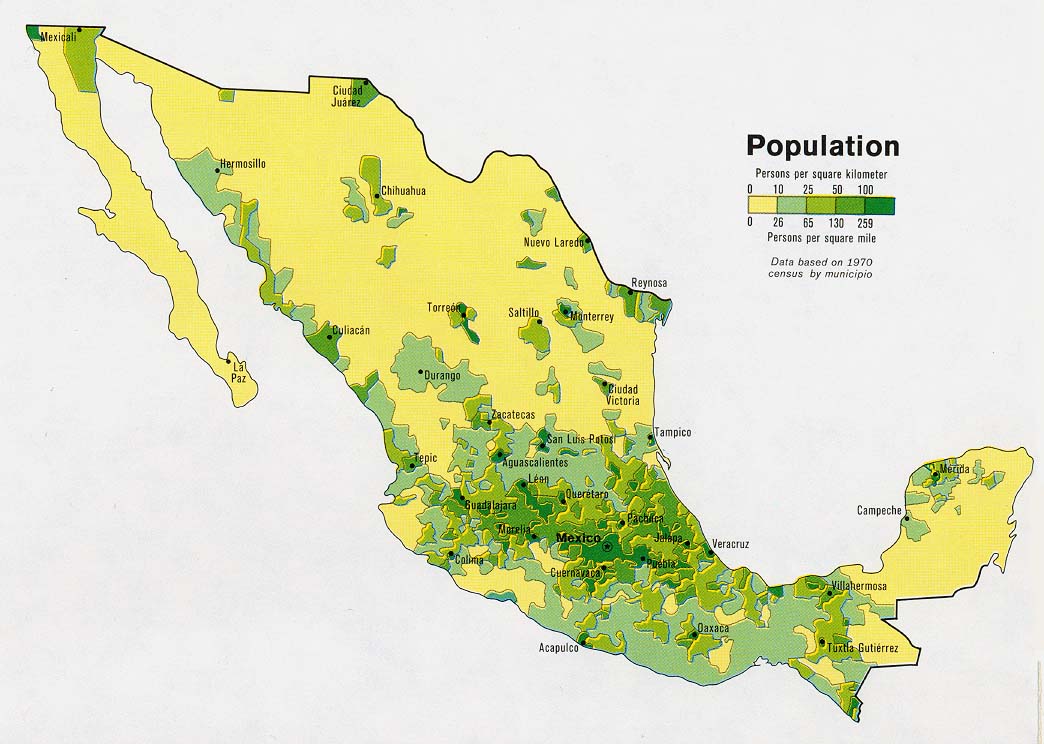
If the Map of the Week is matched with a population density map of Mexico, provided by the University of Texas, Austin, one will discover that most of the population is concentrated around a bulge where the epicenter is Mexico City (metropolitan population of 22 million people). In this area, population density can run anywhere from 26 to 259 people per square mile (10 to 100 people per square kilometer)(maps.lib.utexas.edu). This area also happens to be the area where water allocation stress is very likely to be under the High or Very High category in the Map of the Week.
Mexico’s water crisis has no end in sight and continues to plague Mexican citizens across the country. 55 million residents (42% of the population) do not have access to adequate sanitation facilities (water.org). Residents are forced to put up with the exorbitant costs of purchasing water tanks that consume half their weekly income. Schools in affected areas are letting students out for summer vacation weeks earlier because they cannot acquire enough water for the students. (newyorktimes.org).
Tying back the whole idea to the map of the week, changes in geography, topography and climate can play a great deal in where people live, along with their quality of life. Most Mexicans live in the south and central part of the due to more amicable climates and landscapes opposed to the dry and less-livable Sonoran and Chihuahuan deserts. Geography can also take into account how vital resources such as water are allocated throughout an area, and can display the negative consequences that affect the population if the resources are not distributed equally.
Understanding geography is paramount in order for one to accurately evaluate any world problem, including but not limited to water shortages, climate change, economic turmoil, and even coup d’etats, along with why some nations seem to have more violence than most. Evaluating the world without taking geography into account is like voting for a political candidate by simply flipping a coin; it’s completely unsensible and it does not logically explain why one voted for the candidate representing the tails side of the coin. In order to actually arrive to a solution to a problem as grandiose and complex as the Mexican water crisis, a fundamental understanding of geography is the foundation for the innovative ideas that will follow suit.
Evapotranspiration Map, provided by the NASA Earth Observatory
Population Map, provided by The University of Texas, Austin
Climate Map, provided by The University of Texas, Austin
Atlas of the Week Link:
For the Atlas of the Week, here is a digital map of all the locations listed by Atlas Obscura, cartographer of strange and unknown places! I received a copy of the print edition of Atlas Obscura when I was in middle school and I was so amazed by the presence of all the world’s hidden gems, such as the Child Eater of Bern statue in Switzerland, and the various Buddhist Hell (Naraka) gardens spread out throughout Thailand. This book is one of the many sparks for my passion for travel and to learn about all the different cultural and natural beauties that the world has to offer. Please browse this atlas at your own convenience, there are even some Atlas Obscura locations right here in Richmond, VA!
Blog of the week link
For the blog of the week, here is a map blog from Instagram blog account that posts informative, unique, and funny maps. A small portion of these maps are known as sh*t posts, which are made for satirical purposes. Please enjoy.
Bibliography:
Map of the Week! Blog Post
- Rodriguez, Cesar, Maria Abi-Habib, and Bryan Avelar. 2022. “Mexico’s Cruel Drought: ‘Here You Have to Chase the Water.’” The New York Times, August 3, 2022, sec. World. https://www.nytimes.com/2022/08/03/world/americas/mexico-drought-monterrey-water.html.
- water.org. 2022. “Mexico’s Water Crisis – Water in Mexico 2020.” Water.org. 2022. https://water.org/our-impact/where-we-work/mexico/.
- Patel, Kasha. 2021. “Widespread Drought in Mexico.” Earthobservatory.nasa.gov. May 4, 2021. https://earthobservatory.nasa.gov/images/148270/widespread-drought-in-mexico.
- Central Intelligence Agency. 2016. Review of Mexico Allocation Water. Edited by Central Intelligence Agency. Cartography Maps 2010. Flickr.com. https://www.flickr.com/photos/ciagov/albums/72157674854391962.
- Worldometer. 2023. “Population by Country (2020) – Worldometers.” Worldometers.info. Worldometer. July 16, 2023. https://www.worldometers.info/world-population/population-by-country/.
- Perry-Castañeda Library Map Collection. 1978. Review of Population. Edited by University of Texas, Austin. Atlases and Thematic Maps. University of Texas, Austin: Perry-Castañeda Library Map Collection. https://maps.lib.utexas.edu/maps/americas/mexico_pop_1978.jpg.
- Perry-Castañeda Library Map Collection, ed. 2012. Review of Principales Lipos de Clima de México. mexicochannel.net. https://web.archive.org/web/20120316194223/http://mexicochannel.net/maps/climates.gif.
Atlas of the Week:
- Atlas Obscura. 2017. “All Places in the Atlas on One Map.” Atlas Obscura. Atlas Obscura. June 9, 2017. https://www.atlasobscura.com/articles/all-places-in-the-atlas-on-one-map.
Blog of the Week
- “Instagram.” n.d. Www.instagram.com. Accessed October 26, 2023. https://www.instagram.com/fanmaps/.
Excellent post! I found this map to be very informative and sadly surprising. Additionally, I appreciate your detailed analysis of the map, especially your use of statistics throughout the post. Your point on how the CIA might have produced this map to be a comparison of how Mexico is handling a drought that could impact the US in the future was very well thought out. With the progression of climate change, droughts are increasing throughout the world, including the US. I also think that they could be tracking this issue to try to predict if there will be any spikes in immigration due to the scarcity of resources/water. For instance, it can be seen that the areas closest to the border are darker in color symbolizing a high risk of stressed water allocation services, which can be problematic for the United States due to their close proximity. Again, great job!
Very interesting map and a great analysis. As someone from the Southwest, this is no surprise to me but it is saddening. The first thing you are told when you get into Mexico is to not drink the water and to drink bottled water instead, due to the real possibility of getting Montezuma’s revenge. This should make it clear that while they are dealing with the problem of obtaining water in the first place, the Mexican government is not doing enough to prevent wastewater from contaminating the drinking supply. Similar to the United States, the drought Mexico is facing, as you pointed out, is largely due to climate change, and that’s why I think it is interesting that the CIA made this map. While the drought has not affected the U.S. as much yet, it is inevitable and it is imperative we do something about it. Seven states use the Colorado River for water and the water is quickly running out, and we have seen how the water crisis is crippling Mexico, so it should make it clear to our government that climate change must be acted upon. Great maps and a good cause, great job Tommy.
Great blog entry! There is definitely a correlation between the two maps here. The most densely populated areas of Mexico in the South have the least water stress, excluding Mexico City and the surrounding area. Water scarcity is a serious problem and it will get worse in the future, and it is important for governments to tackle this issue. There are also droughts in California and the West because of climate change and because the region is a desert. City planners need to be mindful of the natural climate of the region and how different cities have different needs that need to be allocated for the inhabitants. Climate change and proper funding and allocation of water resources need to be addressed.
Nice post Tommy! This post on Mexico’s water crisis highlights some major issues the country is facing. It’s concerning to see that a significant number of Mexicans don’t have access to clean drinking water, and the struggles with water shortages are hitting low-income citizens the hardest. The connection between political unrest and unequal water distribution is an eye-opener, especially when government-sanctioned water-delivery trucks play a crucial role in providing water to struggling neighborhoods. The impact of climate change on Mexico’s water patterns is also alarming, with the ongoing droughts affecting a large part of the country. I think you did a great job emphasizing the importance of considering geography in understanding and finding solutions to complex issues like water shortages. Overall, this post paints a vivid picture of the challenges Mexico is facing and the need for strategies to address its chronic water crisis.