Science Daily

Hey everyone! It took me a while to decide on a geography related website to post in the blog. Ironically, the site I finally chose, sciencedaily.com, has been a favorite repository of random scientific facts and knowledge for a while now for both myself and my father (it is my dad’s homepage, so every time I use dad’s computer I am greeted with the latest interesting scientific news. My dad does not qualify as a scientist (he sells beer for a living), but every time he finds something cool on Science Daily he emails it to me. Like literally every time haha). Anyway, when you log on to Science Daily you immediately see the days top headlines in the scientific world. For example, today’s top stories include titles such as Ancient Stars Shed Light On the Milky Way, Whiskers: Milestone in Evolution of Mammals,  The Strange Rubbing Boulders of the Atacama, and Bats Can Rapidly Change Ear Shapes. Everytime that I log on I tend to unconsciously dedicate 15 to 20 minutes of my time sifting through novel discoveries.

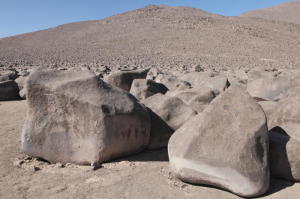
Today’s most interesting topic was about the unique boulders of the Atacama Desert, which ties in nicely with out recent study of the lithosphere and weathering processes. The large , smooth boulders found in the driest desert on earth were dislodged from hills surrounding the various basins located in the desert. Due to frequent seismic activity and earthquakes, the boulders, which have been in the basin for nearly 2 million years, rub against each other many times over the course of geologic time which creates their characteristic smooth sides. This process of weathering is extremely rare, and can only be found in areas of extremely low rainfall and high seismic activity, two conditions characteristic of the Atacama Desert. A picture of the boulders taken from the article is shown below.

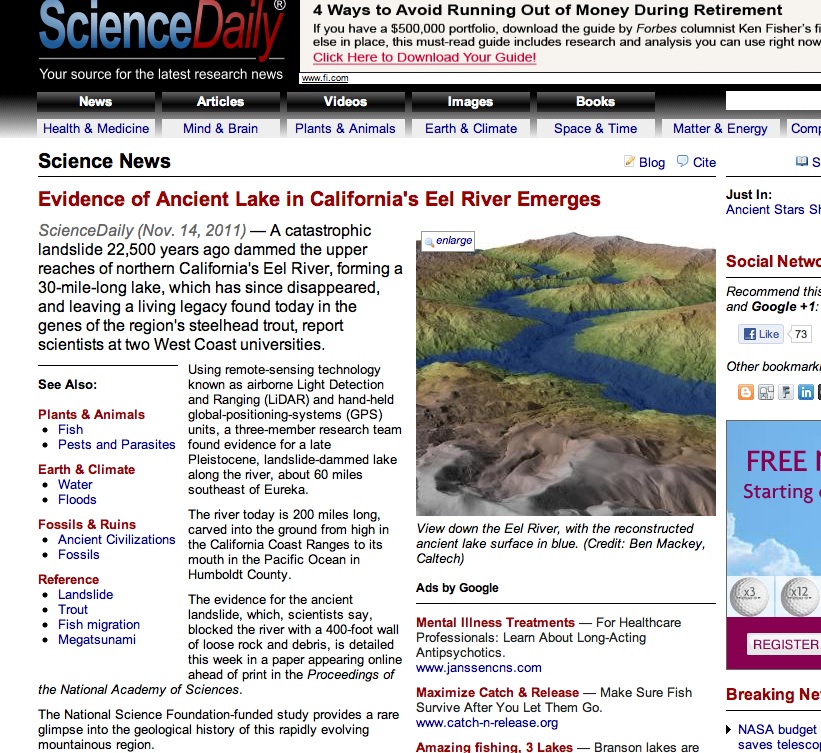
The website contains a lot of other cool features that allow you to find articles regarding specific topics. These topics vary temendously and include a myriad of topics associated with the atmosphere, hydrosphere, lithosphere and biosphere. For instance, one of today’s articles, titled Evidence of Ancient Lake in California’s Eel River Emerges, credits a past catastrophic landslide with the creation of a lake that affected, and still today affects, the gene’s of the region’s steelhead trout. It is a fascinating study that connects changes in the lithosphere and hydrosphere dictating changes in the biosphere. This article could be found under 3 different tabs (Plants & Animals, Earth & Climate, Fossils & Ruins), further proving the interconnectedness of the science of physical geography. Geography itself is a topic tagged in many of the posts, including an article about the spatial distribution of long-term carbon storage in the Ganges Basin. This website is really interesting, and like I said, if you spend a couple of minutes searching through the varying articles you are bound to learn something really interesting!


THE MOST INTERESTING BLOG EVER-PLEASE COMMENT!

About Project Noah: http://www.projectnoah.org/about

I came across the website through an advertisement on the National Geographic Website. Clicking on the link soon lead me to an interesting project that four NYU graduates have created. Entitled “Project Noah”, the experiment attempts to build a fun, location-based database mapping out wild-life intercations all around the world. The way Project Noah works is that anywhere at anytime, if you come across an organism, you take a picture of it, post it on the website, and attribute a location to where you spotted it. Oftentimes, members do not know the “official” names of the organisms that they take pictures of- but that is where the social networking aspect of Project Noah comes in. On the website, you can post and comment on the pictures by writing the name of the organism or general feelings toward the picture.

Another aspect of Project Noah is that it conveys the vast biodiversity around the world. With over 120,000 participants, and over millions of pictures uploaded, Project Noah serves as a catalog for speicies diversity and dispersion. Members can also participate in “missions”, which link all the classified organism pictures into a central location such as the National Saguaro Park. This helps scientists count and identify the certain species in the Park.

Project noah’s most notable feature is that it can be downloaded as an app, so pictures and categroizations can be uploaded easily and at any time. I see this whole project as a way to encourage people to reconnect with nature, documenting local wildlife, and creating “citizen-scientists”.

Sunspots, Active Region 1339

By: Shane Sullivan

Sunspots are magnetic storms on the surface of the Sun which are sometimes visible from Earth as black dots on the surface of the Sun. Recently scientists observed the largest group of sunspots seen since 2005 which collectively are “approximately 17 times the width of our planet”. This group of spots has been named active region (AR) 1339 and is of particular interest to scientists because of its current orientation in relation to the Earth.

“A picture of the sunspot cluster known as AR 1339 taken with a backyard telescope”

AR 1339 is now located in the center of the Sun directly pointing towards Earth which has the potential to cause damages to satellites and humans if solar flares become active. Although, the last solar flare activity recorded from AR 1339 was on the 3rd of November flares can become active anytime and are at most detectable within minutes of the occurrence. These flares have a high potential to disrupt satellites and due to radiation exposure pose health risks to airline pilots and scientists aboard the space station.

While AR 1339 is visible to the naked eye Philip H. Scherrer, a Stanford professor, warns, like Tiho, that “people should never look directly at the sun”.

http://news.nationalgeographic.com/news/2011/11/111110-sunspots-ar1339-earth-jupiter-solar-flare-auroras-space-science/

Snowtober 2011 in the Northeast

The North East and Mid-Atlantic region of the United States (from West Virginia to Maine) experienced an unseasonably early snow storm on the weekend of Halloween, October 29-30, 2011. The nor’easter brought as much as 81 inches of snow in some places and the weight of the snow on the still-attached leaves, made branches to snap more easily. The snapping of trees led to many downed power lines and a chaotic attempts by utilities personnel to restore power. Over 3 million homes lost power during this time, exceeding the number of power outages experienced in September 2011’s Hurricane Irene.

Central Park in New York City broke records – it was the only time in its history that snow accumulation exceeded 1-2 inches within the month of October. By the first morning of the storm on Saturday, October 29, 2011, Central Park had already received 2.9 inches of snow.  The storm also brought New York City closer to the “all-time wettest” year in its history,  In total, the storm gave New York City 65.75 inches of precipitation – over 2 feet above average! In New Hampshire and Massachusetts, 31.4 inches and 32 inches of snow were produced, also above average during the month of October. According to NOAA, the Northeast had 86% snow cover with approximately 4” deep. Very, very unusual.

http://earthobservatory.nasa.gov/IOTD/view.php?id=76267

NASA's "Image of The Day" during Snowtober 2011

One weather historian Christopher Burton has called the storm, “the most extraordinary October snowstorm in over two centuries in the northeastern US”. This unseasonable snowstorm is further proof of a warming world. With warmer temperatures, the atmosphere is able to hold more moisture and thus heavier precipitation. With temperatures falling just below freezing during late October 2011, this precipitation came down as snowfall.


Freedman, A. (2011, October 31). Historic October Northeast storm: Epic. Incredible. Downright ridiculous. Capital Weather Gang. The Washington Post. Accessed November 5, 2011

What’s Your Pollution Scorecard?

Coal-fired power plantDespite the success of national legislation like the Clean Air Act, the Clean Water Act, and the Federal Insecticide, Fungicide, and Rodenticide Act, pollutants still enter the environment at alarming rates. We can easily identify obvious sources of pollution—sulfur dioxide is bound to be coming out of a coal-fired power plant’s smokestacks—yet often less-obvious sources go unnoticed.

When pollution from any of these sources enters the environment, the substance likely enters either the air, local ground or surface water, or the soil; some of these substances may remain in these locations for many years. These chemicals have obvious effects: human and environmental health suffer in a variety of ways.

Nevertheless, the landscape of the region and the physical distance from a polluter means that some locations will experience only minimal levels of a pollutant. Wind and other weather patterns could transport a pollutant away from region and toward another; a city-dweller living next door to a factory will inhale many more toxic chemicals than will a rural farmer living kilometers away.

Luckily (or not, depending on your perspective) there is an online tool to determine which polluters exist in your locality. By visiting Scorecard, you can input your home or current zip code and get a list of polluters in your locality, the location of those polluters, how much pollutant they emit, and which pollutants are most prevalent where you live. For instance, I learned a company was emitting lead-based compounds from what I thought was an office building adjacent to the suburban neighborhood where I grew up! You can also see if any Superfund sites exist near you, determine the cleanliness of your local water, and learn what percentage of homes in your area have risk for hazardous levels of lead.

How many polluters are in your locality? Are you surprised at what you find out? Let us know in the comments!

Bill Nye the Science Guy on Climate Change

by Amanda Doyle

He taught us the physics behind flight, mechanisms in an eyeball, and layers of the atmosphere (all accompanied by pop music parodies), but now, Bill Nye the Science Guy tackles a much more difficult issue… climate change.  An advocate himself, Bill makes frequent appearances at universities and conventions, and on news broadcasts addressing this modern concern.  In February 2010, soon after a blizzard crippled Washington D.C.,  Bill spoke on MSNBC as a guest of Rachel Maddow.  Many disbelieving politicians utilized the blizzard to debunk the theory of global warming; however, Bill explained that climate change may have been the driving force that created the catastrophic storm.  Accustomed to educating an elementary audience Bill provided a clear and concise explanation of climate change, one both students and elders alike could understand and appreciate.


Bill Nye Science Guy on Rachel Maddow Talking About Climate Change
msnbc, “Bill Nye Science Guy on Rachel Maddow Talking About Climate Change,” Youtube video, http://www.youtube.com/watch?v=sm05Mcah0i8 (accessed October 1,2011).

First, Bill clarifies that global warming was the initial term to address this phenomenon but since global warming created numerous misconceptions the current accepted expression is climate change.  He continues to explain that more energy is being trapped within Earth’s atmosphere and all of this energy is “stirring things up.”  Consequently, the world is warming leading to more intense phenomena, such as El Niño, which has a profound effect on weather in North America.  When Sea Surface Temperatures (SSTs) increase during El Niño more energy is released into the atmosphere making conditions more turbulent and resulting in extreme weather that can range from extreme drought, excessive rain, and even atypical snowstorms.

Lastly, Bill states that disbelievers of climate change are “unpatriotic,” and he reminds us that the Intergovernmental Panel on Climate Change received a Nobel Prize for their extensive research that brought to light this phenomenon, which will remain a heated topic of debate for years to come.

THE ART OF GLOBAL WARMING coal + ice photography exhibition open at three shadows

by Avery Shackelford
Nadav Kander, Chongqing IV (Sunday Picnic)
 Series: Yangtze, The Long River,
 Chromogenic Colour Print

 2006
 Chongqing, China picture taken from: http://sites.asiasociety.org/coalandice/photographers/ , picture credit information taken from: http://www.prixpictet.com/2009/view/605/5211

An art exhibition open Sept. 24 – Nov. 28 at the renowned Three Shadows Photography Art Centre in Beijing features the works of 30 photographers hailing from across the globe including the United States, the United Kingdom, China, Norway, Russia, Italy, Canada, Malaysia and Germany.

These artists’ photographs tell a story from the base of the coalmine to the peaks of the Himalayas.

Photographs, including those taken by American photographer and filmmaker David Breashears, who co-directed the first IMAX film shot on Mount Everest, demonstrate how the use of coal emits greenhouse gases that are warming high-altitude climates like the Himalayas, where rapidly melting glaciers are affecting river currents, which in turn play havoc with the lives of downstream residents.

The photographs span an “arc” of phases showing how greenhouse gases resulting from coal use go up into the atmosphere causing the glaciers to melt, thus affecting the hydrologic cycle. The exhibition also includes time-lapse photos that show the changing landscape.

The goal of the exhibition is to promote environmental awareness as well as tell a beautiful, yet haunting visual story.

For more information, and to watch a behind the scenes video with commentary from the curators see the gallery’s Web site: http://sites.asiasociety.org/coalandice/


Sky-Map.org

Sky-Map.org (or Wikisky.org) in an interactive website that allows you to view the universe through one of the most powerful telescopes in the world. From the main page, you can click on one of the 500,000,000 cataloged objects, or choose one from the list on the right side of the page, and you are immediately transported to another world. The up-close view of celesial objects such as the Carina Nebula is accompanied by detailed scientific information. The site also contains thousands of stunning photographs, adding an artful component to the educational and scientific potential that this site holds. My personal favorite: the Butterfly Nebula (NGC 6302): http://server5.sky-map.org/starview?object_type=3&object_id=286

http://www.sky-map.org

Hurricane Tracker

http://www.surfline.com/hurricanetrak/

Hurricanetrak is a great tool that can be found on surfline.com. It allows anyone to follow or track the path of a tropical system or hurricane anywhere in the world. You also can keep an eye on weather conditions. The primary objective of this tool is to help surfers know where the best surf is. By using other tools, such as LOLA and Google maps, you can zoom in and out of storms, display various layers of forecast data, and also use interactive shadows and rulers to see exactly where a storm is going. LOLA is a global surf forecast. During hurricane season you can click on  individual storm names to see the current storms path. You can also access historical data to research previous storm activity. Specific details, such as wind speed, pressure, wind and swell direction, and wave height can be examined as well.

Aurora Forecasting

If you have been curious about the Northern Lights or Aurora Borealis there is no time better than now to check out more about this awesome natural phenomenon.  The aurora borealis is essentially the result of protons and electrons from the sun colliding and mixing with the Earth’s atmosphere and magnetic fields.  When this happens there is an awesome display of color that occurs at both the North and South Poles, though the north is better known for it in my experiences.  The Northern Lights are absolutely remarkable and this website predicts how good they will be.  The Geophysical Institute is sponsored by the University of Alaska Fairbanks and their website puts up predictions for how well and when the Lights will be able to be seen.  The website also talks about interpreting the forecast and tips for how to plan to see the Aurora Borealis when it is at its best.  I suggest checking this website out if you would like to know more about the Northern Lights.

http://www.gi.alaska.edu/AuroraForecast/2011/04/27