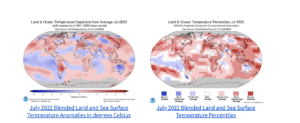
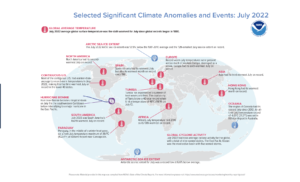
The National Centers for Environmental Information, an office of the National Oceanic and Atmospheric Administration (NOAA), includes products by category surrounding the monitoring of the climate. The objective of the National Centers for Environmental Information is to develop products and services spanning all the science disciplines and allow for enhanced data discovery. Their website is “one of the largest archives of atmospheric, coastal, geophysical, and oceanic research in the world.” There is data for monthly climate reports, including reports on wildfires, droughts, tornadoes, snow, and ice, and overall information about the climate. You are able to specify what year, month, and type of report you would like to view. Once decided on what you would like to look at, there is a national overview that lays out significant climate anomalies and events for the specific month and year that was chosen. There will also be maps detailing the average temperatures and precipitation percentages. There is much more to this website besides the climate reports, however, I chose to just focus on one aspect. The main goal of these reports is to display monthly summaries of climate-related occurrences on the global and national scale.
The climate reports are extremely relevant to our class, as we have an entire chapter of our textbook dedicated to water, weather, and climate systems. We will spend a decent amount of time discussing the atmosphere, as well as the climate. Through these monthly climate reports we can compare months to examine how the climate/temperature has changed and come up with potential reasons as to why. Throughout week 2 we are going to focus on the atmosphere as well which has to do with the climate, weather, and other things occurring.
Below is an example map of the temperature, and significant climate anomalies and events for the month of July. 

