
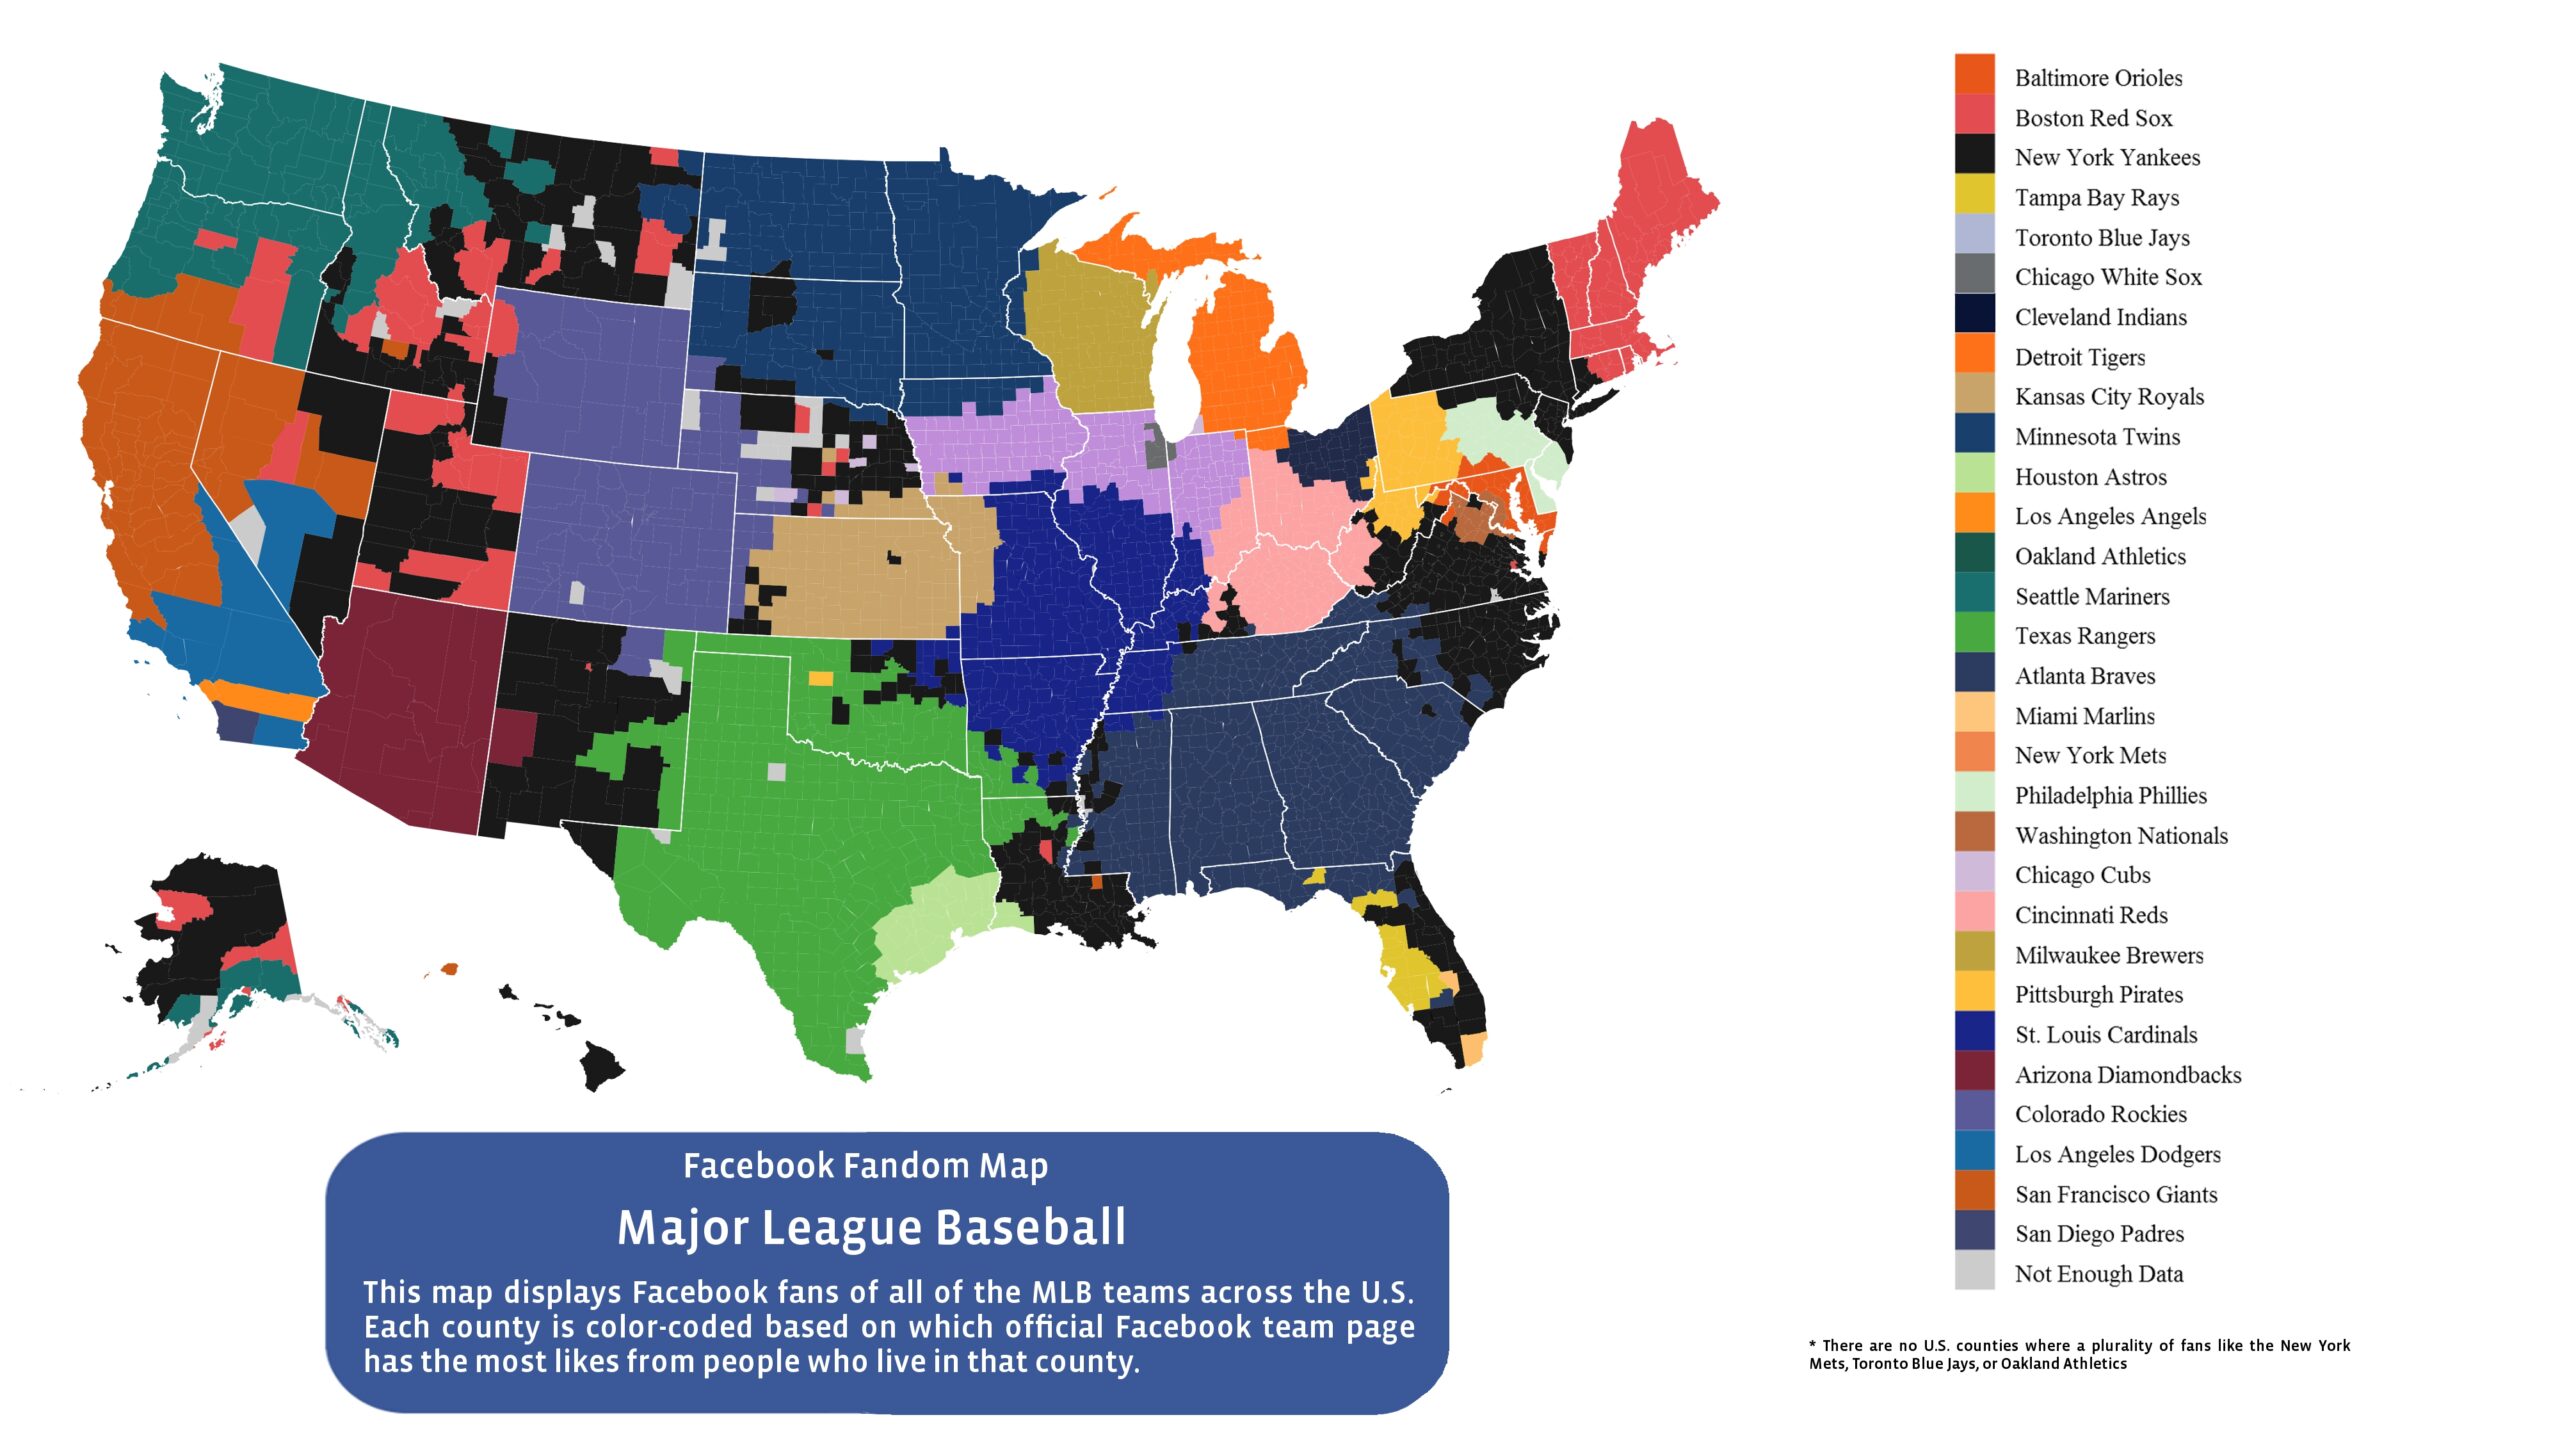
For much more than a century, Major League Baseball (MLB) has been an integral part of American sports culture. The league began in the 1860s with just eight clubs and has since expanded to become a flourishing national organization. This historical background is crucial to understanding an intriguing map that shows the most popular MLB clubs on Facebook broken down by county and made in 2014. This map provides insightful information on the geographical dynamics of baseball fans in addition to illustrating the scope of MLB’s influence. The relevance of this map, the historical background of MLB’s growth, and its connections to the larger topics of cartographic rhetoric will all be covered in this article. Based on Facebook likes in 2014, the map under examination provides a unique viewpoint on the regional spread of MLB fans. It sheds light on the strength and popularity of America’s pastime by highlighting the teams that have the largest fan bases in every US county. Given their legendary past and sizable fan base, the New York Yankees’ dominance over a significant portion of the map may not come as a surprise to many. But what’s really interesting about this map isn’t only the teams who are well-known—it’s also the ones that aren’t.
Especially notable is the lack of a majority of supporters in any U.S. county for clubs such as the Oakland Athletics, Toronto Blue Jays, or New York Mets. Understanding the historical background of MLB’s growth is essential to appreciating the relevance of the map. As previously indicated, the league’s founding consisted mostly of eight clubs from the Northeast and Midwest of the United States. MLB’s impact grew as more clubs were added in other locations, creating new fan bases and expanding the league’s reach. Thanks to this growth, baseball was able to develop into a national pastime that is dear to the hearts of Americans. It also meant that certain teams would inevitably gain greater popularity than others, and this map illustrates how that expansion turned out. It ornaments the history of Major League Baseball’s expansion and the geographic variety of its fan base, serving as a visual depiction of the sport’s cultural influence. Additionally, the omission of some teams from the distribution of the map highlights the contrast between baseball’s long-standing titans and its less significant competitors. Another idea to think about would be the popularity of each team based on another form of data rather than facebook likes. Based on attendance, the most popular baseball teams are the Dodgers, Cardinals and Yankees. However that is not concurrent with the data presented in the map above. In the context of our course themes surrounding the rhetoric of cartography, this map offers several insights.
Cartography is more than just drawing lines and shapes on a map; it is also about communicating information, uncovering patterns, and telling stories. The Facebook likes on this map tell the story of baseball’s popularity as it spread from its roots in the Northeast to every corner of the country. It demonstrates the power of data visualization by demonstrating how historical and cultural factors influenced the geographic distribution of MLB fandom. The absence of certain teams on the map serves as a subtle reminder of the complexities of regional allegiances, demonstrating how certain franchises have maintained their stronghold in specific areas. This concept also has pull financially, the more supporters an organization has the more In conclusion, this map of the 2014 MLB teams with the highest Facebook likes is an engaging illustration of the cultural significance of the sport and the results of its growth over time. It is the “Map of the Week” because it illustrates how a well-made map can provide a distinct combination of geographical insights, historical context, and current data. By examining the map through the lens of cartographic rhetoric, we gain a deeper appreciation of how maps are not just static images but tools that help us understand the intricate relationships between culture, geography, and fandom in America’s favorite pastime.
Blog Link- https://www.instagram.com/maps_black/
This instagram page, though most posts are written in Spanish, offers comedic and interesting maps about a variety of topics. Including but not limited to sports, politics, and video games.
Atlas Link- https://www.opportunityatlas.org/
The Opportunity Atlas shows which neighborhoods in America offer children the best chance to rise out of poverty. It’s really interactive and allows the user to see where opportunity has been missing. It could be used to develop solutions in order to help more people get out of poverty.