
 https://automatingbanishment.org/map/
This map is an interactive map titled Automating Banishment and its goal is to uncover “LAPD’s data-driven policing programs that control, displace and criminalize people and places”. The Los Angeles city attorney’s office implemented a program in 1997 titled the Citywide Nuisance Abatement Program. The program utilizes LAPD surveillance and community policing in order to be enforced and effective.
This specific map focuses on other programs that implement LAPD surveillance. This map was created by members of the Stop LAPD Spying Coalition and they have been researching LAPD surveillance programs and their effects on Black and Brown communities in Los Angeles. With their research, the coalition was able to uncover four tactics or programs other than the Citywide Nuisance Abatement Program that use LAPD surveillance as a means of control and intimidation. The Operation LASER program was active from 2011to 2019 and operated by marking areas “LASER zones” which were targeted by the City Attorney and LAPD. This program more than likely was a program within the CNAP program because the areas that were targeted were targeted for increased nuisance abatements as well. In addition to LASER zones, the LAPD focused on areas marked as Anchor Points. Anchor Points were areas that were marked for increased police surveillance and nuisance abatements. These Anchor Points could include specific addresses, landmarks, and intersections. In addition to using surveillance to gather data on places to target, from 2011 to 2020 the LAPD used a system called PredPol. This system was a “predictive policing” system powered by algorithms that guess places where crime happens. The last tactic that is highlighted on the map is the Community Safety Partnership Sites which are locations that are targeted by the LAPD for a “community policing program”. These sites were launched in 2011 and were recently expanded citywide in 2020.
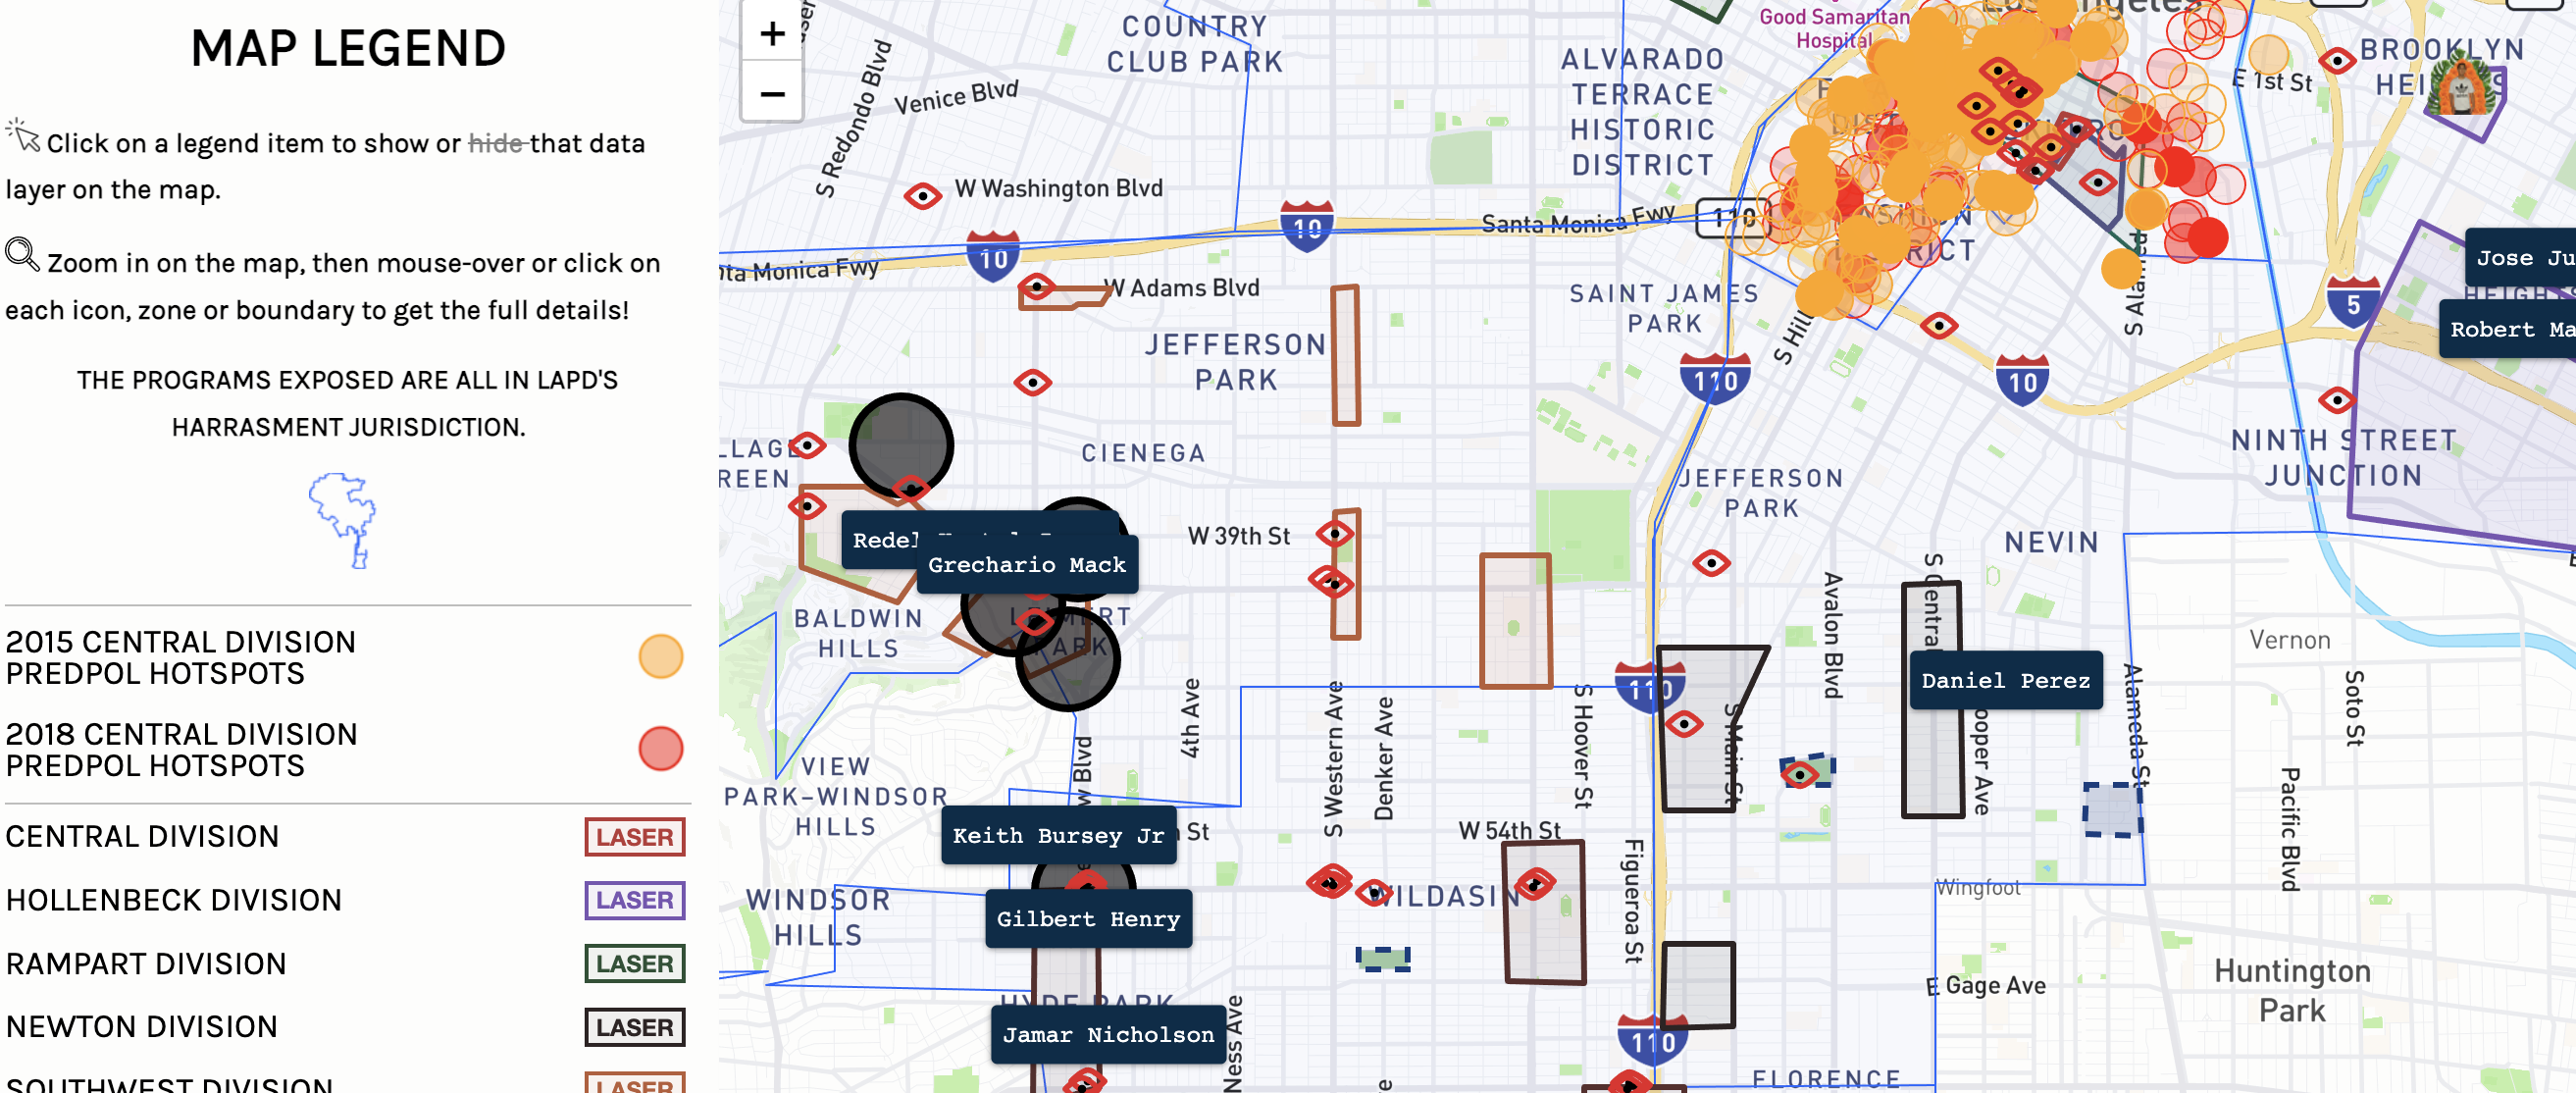
All of these tactics are displayed on the interactive map with detailed incidents caused by the tactics and programs. Things that are displayed on the map include “People shot or killed by LAPD in or around LASER zones”, “2018 central division PredPol hotspots”, “Community safety partnership zones”, and “Anchor Points”. Within the map, the members of the coalition use language like “pigs” in order to describe the LAPD and they also try to humanize the victims of LAPD shootings in their descriptions of the shooting incidents. Displaying the various tactics and programs on a map while using rhetoric that affirms their position allows the members of the coalition to be strong counter mappers and stand firm on their position. The coalition makes it very clear that the LAPD is a problem in their communities and that the issues move far beyond what any average citizen may be able to see. Their map is able to illuminate problems that require years of research and dedication to uncover. Maps aren’t mad in a day and neither are counter maps. One important distinction between countermapping and conventional mapping is that the cartographers of conventional maps don’t have to disclose their position whereas counter mappers must disclose where they stand on an issue because they are mapping the issues as well as the respective area.
The political discourse surrounding police surveillance can be daunting for those involved but the Stop LAPD Spying Coalition doesn’t seem to be bothered by the backlash they will receive because of their brave way of mapping. The counter mappers of this map want their viewers to understand how vast and widespread the issue of police surveillance is and it goes way past patrolling a neighborhood. The tactics and programs implemented by the city attorney’s office and the LAPD are so unethical but still lawful so trying to deconstruct these programs using counter-mapping may seem pointless. However, grassroots efforts are successful and this organization seems to have a good grip on the issues and the powers that be.