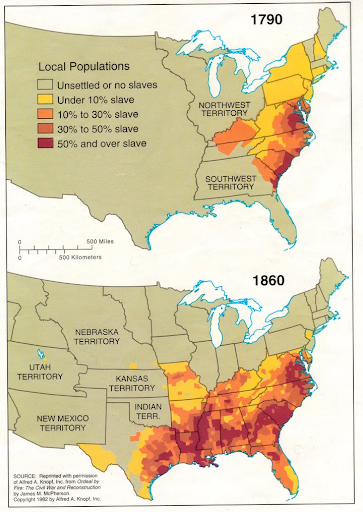
This map gives some insight on the increased concentration of slaves in the United States throughout the years 1790-1860’s. The swift growth in the increased numbers of the amount of slaves there kind of gives you a sense of just how intertwined slavery was in our previous history. The first slave voyage that went from Africa to the Americas sailed sometime around the year 1526. Afterwards the majority of the enslaved Africans brought to British North America were transported throughout the years 1720-1780’s. It’s very important to note the role slavery played in the development of the United States. With the increased demand for the New World cash crops like sugar, tobacco, rice, as well as cotton, farmers in the newfound British colonies quickly came to favor enslaved Africans for the need of labor in order to cultivate these crops (Lumen).
One of the more primary ways Europeans would obtain slaves would be via the Atlantic Slave Trade. The vast majority of the slaves that were transported to the New World were the Africans from the central and western parts of the continent. Some African tribes would pillage and raid other rival tribes as a means to sell them to European slave traders, who would then transport them to the colonies in North and South America for distribution. Many different tribes played a key role in the development of the slave trade by selling their captives or prisoners of war to the European buyers. At the time this was a common practice on the continent. The captives who were sold to the Europeans were usually from neighboring or enemy ethnic groups (Lumen).
I think this map is pretty interesting and should be showcased as the map of the week. Because I think it kind of gives you a visual understanding of just how important the enslavement of the African race was for the upbringing of this country. The Atlantic slave trade was primarily shaped by the desire of cheap labor in the attempted to produce raw goods for European consumption. Many of the American crops were not able to grow inside of Europe, so the process of importing crops from the New World proved to be far more profitable than producing them on the European mainland (Lumen). Needless to say a vast amount of labor was needed to be able to create and sustain plantations that would eventually become economically profitable. Western Africa had become a gold mine in a sense by becoming the primary source for Europeans to acquire newly found enslaved peoples. All this was in order to meet the desire for free labor in the American colonies, with the end goal of producing a steady flow of profitable cash crops for the near future.
Denis Wood in our readings talks about how maps work by serving certain interests. That means that every map pushes forth a narrative that almost puts everything into the now or the real. Wood writes, “And this, essentially, is what maps give us, reality, a reality that exceeds our vision, our reach, the span of our days, a reality we achieve no other way.” I thought this map connected with our class readings because it kind of gives you a new viewpoint. I don’t believe anyone in our contemporary society, could even fathom slavery still happening inside of our country today. I do believe that maps give you a new outlook in a sense of putting you inside of a reality of something that did take place during a certain time period. Maps give you the ability to be able to look back at the past and acknowledge the events that occurred, while also giving you the ability to look at the reasons behind why certain things were documented. I think if you look back and think about how the rights of those people were taken away, you kind of get a sense of gratitude. In a way of just acknowledging just how far we have come as a country.
References
- Mintz, S. (n.d.). The Gilder Lehrman Institute of american history. Historical Context: Facts about the Slave Trade and Slavery | Gilder Lehrman Institute of American History. Retrieved April 4, 2022, from https://www.gilderlehrman.org/history-resources/teaching-resource/historical-context-facts-about-slave-trade-and-slavery#:~:text=The%20volume%20of%20slaves%20carried,leaving%20Africa%20in%20slave%20ships.
- Boundless. (n.d.). Boundless US history. Lumen. Retrieved April 4, 2022, from https://courses.lumenlearning.com/boundless-ushistory/chapter/slavery-in-the-colonies/#:~:text=The%20rapid%20expansion%20of%20large,backbone%20of%20the%20British%20colonies.
- Wood, D., Fels, J., & Thomas Leiper Kane Collection (Library of Congress. Hebraic Section). (1992). The power of maps. New York: Guilford Press.

