
 https://www.awesomestories.com/asset/view/AMERICAN-DEFORESTATION-The-Lorax
______________________________________________________________
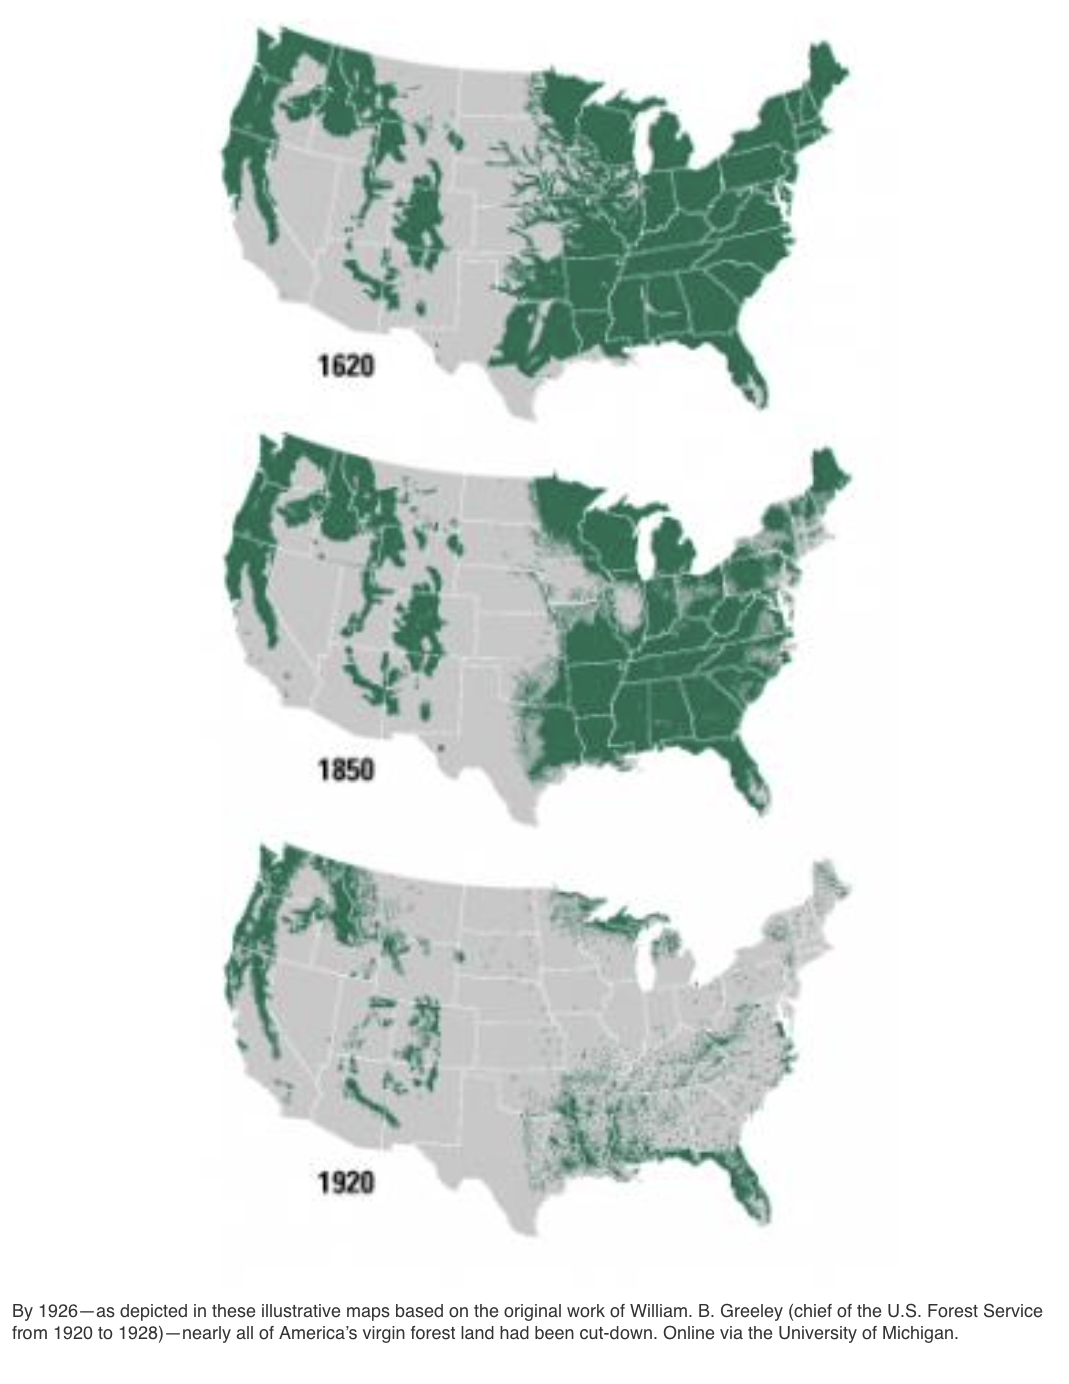
My map of the week showcases American deforestation from 1620 to 1920. This illustration consists of three separate maps that showcase the amount of forest and/or wooded areas across the United States during the years 1620, 1850, and 1920. The title of the map site is “The Lorax- American Deforestation”, and although this topic resembles the well-known Dr. Seuss book, this issue is much deeper and darker.
The root of deforestation stems from colonization and population spikes. As commonly known, Native Americans were already inhabiting North American territory and cherished nature as their main tool of survival. When European settlers came to America, the idea of “living off the land” was taken and warped into a less preserving measure, meaning that the settlers were thinking more economically and less about a healthy environment. The more people that came, the more space needed to live and settle down. The land was a necessity to grow crops, raise livestock, and build housing to provide for one another, and to do that people started cutting down trees to make that space sufficient (Bos).
Colonization serves as a key contextual element in the understanding of the different maps. In 1620, America was far more green than it is in 1920. In 1620, forests covered most of the United States during the time of the 13 colonies (Bos). In 1850, around the time of the Civil War, America’s trees have greatly diminished, especially around the coasts since that area is the most populated (Bos). By 1920, America’s virgin forests were nearly gone and they have decreased even more since then (Bos). These map comparisons show how American progressivism comes with a cost. As Americans, our culture is obsessed with advancement and consumed with the idea that bigger is better. One day reach our capacity of advancement because the land cannot sustain the level needed to continue, let alone be fruitful for survival. Deforestation is a much-needed conversation and issue to be resolved. Attention needs to be brought to the rapid decrease of wooded areas and The Lorax- American Deforestation maps shed light on the catastrophe.
Since environmental crises are nothing to take lightly, the structure of this map can be analyzed with a rhetorical lens. The simplicity of this map can be appreciated because it limits any mess that can cause the message of the project to be lost. With the visuals used, there is no mistaking that the main purpose of this map is to showcase the loss of wooded areas. The green color contrasts perfectly with the grey undertone and it is clear that the amount of green diminishes over time. The shape shown is also a political/traditional-styled map of the United States, which looks fairly accurate to scale at first glance, making the message more believable to the audience. This map would be perfect to use to show the loss of trees to an audience, especially one that is younger, because it does not take much knowledge or analytical skills to recognize the message.
Although the simplicity of the map can be applauded, the use of borders can be critiqued. As noted by Wood in In Wood’s Power of Maps, maps make the past and future present (Wood 7). The use of borders in the showcasing of deforestation can be both critiqued and understood by Wood. In 1620, America was merely the 13 colonies and the 13 colonies only. During the 1850s, America was more defined on the east coast but the West was not fully claimed as American soil. The Lousiana Purchase was still fresh along with the Mexican-American War and Missouri Compromise. States like Oregon, Missouri, Utah, and Texas were not mapped out as the areas we know today. The Lorax- American Deforestation map, however, uses the same borders that construct America today to showcase deforestation, which is historically inaccurate. Critiques, especially political critiques, would note this as a huge fault in the mapping project and could even argue considering this source “unreliable”. However, Wood along with other rhetorical scholars could argue the opposite. This project epitomizes the idea of “making the past and future present” through its use of borders. Examining the United States in the body we know today drives home the idea of making the past present because it allows the audience to see the message of deforestation through a lens in which they understand. For instance, being from Virginia, seeing the deforestation decline within the modern border of Virginia allows me to measure the full impact of deforestation where I live. And the beauty of the use of borders is that the deforestation data would still remain the same if they were not there on the map. The use of borders in this project shows how meaningless they are in a way, and merely are used for social context and nothing more. For instance, people can live 20 miles away from each other but within that distance there can be borders for different states. Different states help identify and group people for structural reasons, especially politically and socially, yet the environment and the deforestation happening around it is not limited to borders.
The Lorax- American Deforestation map can be cartographically analyzed through its simplistic style and use/misuse of borders. Maps help us understand our own reality and as Harley would say, “how it makes the past present”. The more we study them, the more we find out about the world around us, which can help us understand how progressive and degressive we can be as a society. The Lorax-American Deforestation map exemplifies how maps can help raise awareness and provide evidence for all types of concerns within society from environmental to social issues.
MAP LINK: https://www.awesomestories.com/asset/view/AMERICAN-DEFORESTATION-The-Lorax
Works cited
Bos, Carole “AMERICAN DEFORESTATION” AwesomeStories.com. Mar 01, 2012. Mar 20, 2022. <http://www.awesomestories.com/asset/view/AMERICAN-DEFORESTATION-The-Lorax>.
Wood, Denis, and John Fels. The Power of Maps. Routledge, 1993.
Evyn, great work. As a big tree guy myself, I can appreciate this map. I’ve never thought about deforestation being a product of colonialization before so that part was very interesting. I agree that in some cases simple is better. This is a great map for this topic. I think the use of the “Lorax” as a title is great. While it may seem like they are making light of the issue, I think they used this title because everyone knows what the Lorax is and is able to tie in that core connection and might make people more interested.