
 Before leaving for college, my parents were worried about me moving to Richmond. Richmond was notorious for its crime, specifically its murder rate when they grew up. In 1985, Richmond had 93 murders with a murder rate of 41.9 killings committed per 100,000 residents. In 1995, Richmond had one of the highest murder counts in the United States, with 120 murders and 59.1 killings per 100,000 residents. Morgan Quitno Press, a research and publishing company, ranked Richmond as the ninth most dangerous city in the U.S in 2004. Over the next few years, Richmond’s status as a violent city declined steadily. By 2012, Richmond was longer in the ‘top’ 200 most dangerous cities. It was not until 2016 when Richmond witnessed another rise in homicides, with 61 murders reported, as The Richmond Times-Dispatch referred to as “the city’s deadliest year in a decade.”
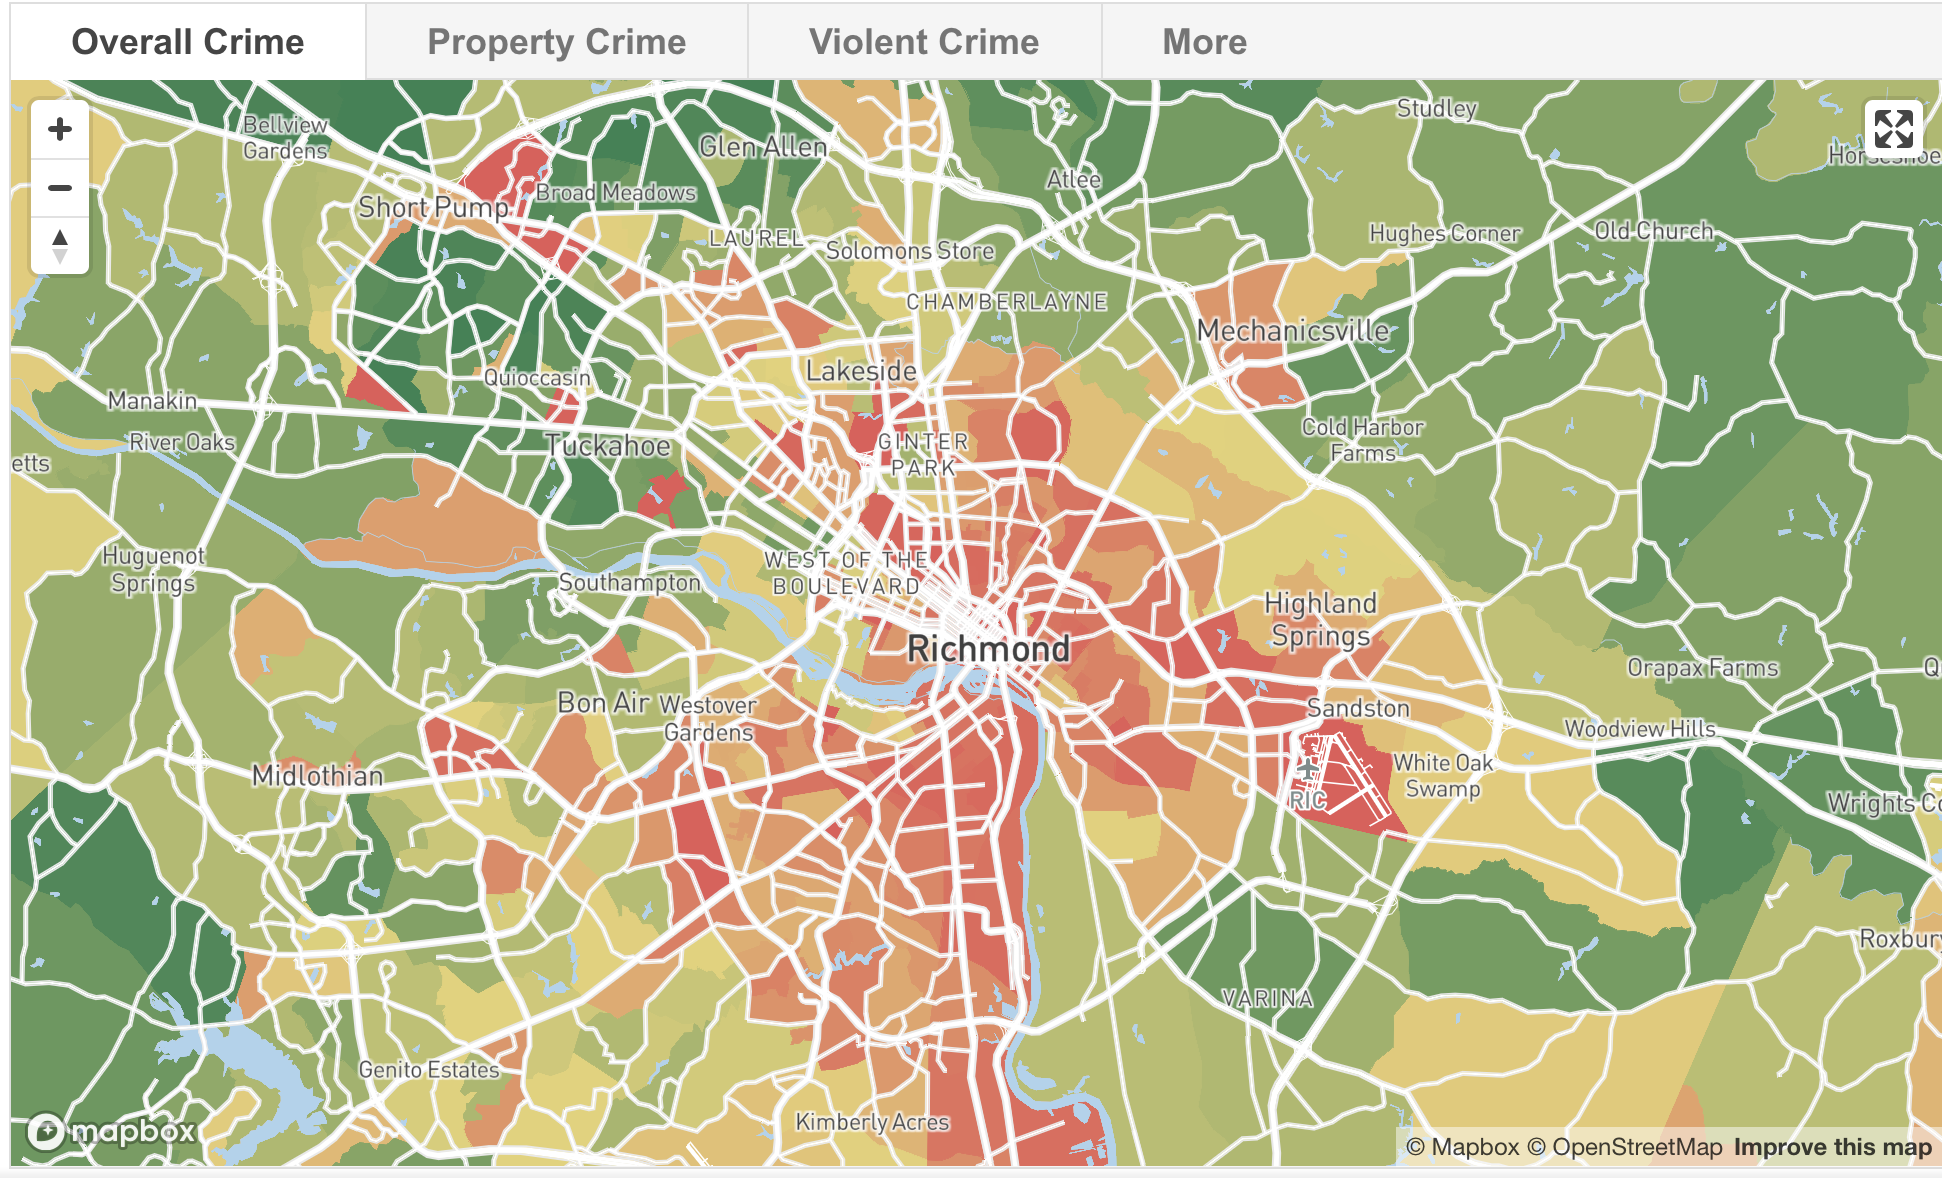
When my parents and I arrived in Richmond, they were impressed by the suburbia and lack of danger. The map above displays the overall crime per 1,000 Richmond Metro residents. The map labels the “crime grades” by showing the safest places in green, the moderately secure areas in yellow and the most dangerous areas in red. The overall grade resulted in a C+, about the same as the average U.S. metro area. It is notable to highlight that the west part of the metro area appears to be the safest, while the city becomes more dangerous as you go more south. A silence of this map is that the rate of crime per resident may appear inflated when people visit the area during the day but do not live there. This skews the statistics as there are several retail establishments in the center of the metro area, which indicated on the map, is a hotspot for crime. These crimes are committed where few people live, as these take place on the street and are committed by visitors. Even people who live around that area would not be affected as much as the crime is not taking place in their neighborhoods, signaling that although they live in a red area, they are still safe. Something else that needs to be acknowledged is that the red spots on the map indicate areas where recreational areas are. People who live by these recreational areas would not be committing these crimes, but unfortunately, one may look at this map and decide not to live there. A map like this inadvertently reproduces inequalities around neighborhoods and public spaces, which can reaffirm stereotypes. That is why it is crucial not solely to base your opinion on one map. In this case, further examination and research are essential in avoiding giving into cliched notions regarding Richmond.
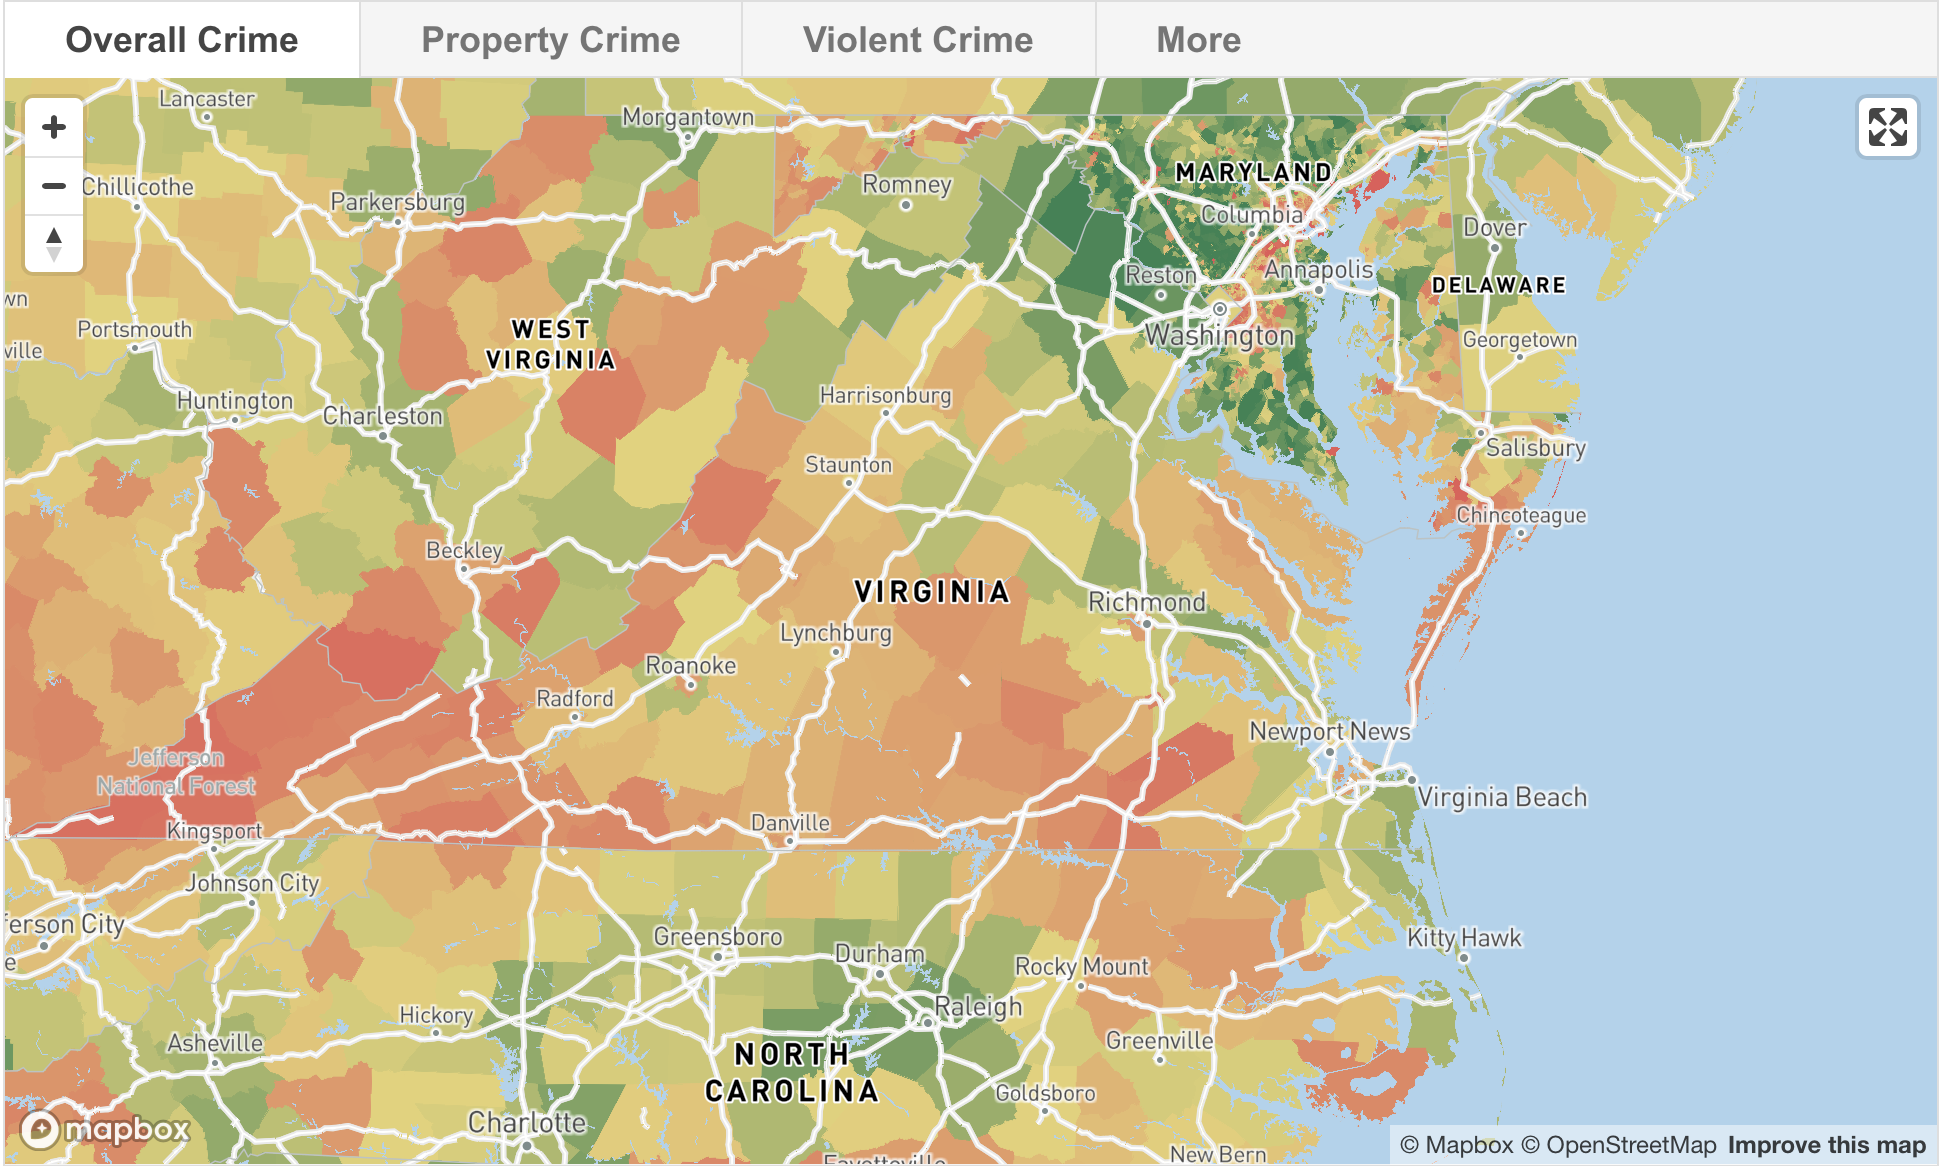 It is interesting to look at the state of Virginia and compare its crime rates to Richmond. As of 2018, Virginia has the fourth lowest violent crime rate and thirteenth lowest property crime rate. The level of crime that circulates the state is notable, with Richmond appearing to occupy a solid amount of green area. The northeast part of Virginia appears to be the safest part of Virginia and the map earned an overall grade of an ‘A,’ indicating the rate of crime is much lower than the average U.S. state. A critique of this map is the lack of symbols and legends. The map is very straightforward and its colors are the main factor in representing its messages. The use of borders is notable, as it divides the map up into distinct sections and highlights the diversity of colors, or crime, amongst different areas. The map does a good job persuading its audience into highlighting how Virginia is a safe place to live, with Richmond appearing on the map to be an extremely safe area. I was a bit confused as to why Richmond received a ‘C+’ grade but appeared on the Virginia map in predominantly green color. In this case, I believe citizen cartography would help to demonstrate an interesting point-of-view of Richmond’s crime in relation to the state of Virginia’s crime. This would give a first-hand account of the matter, rather than relying on statistics that can reaffirm stereotypes. Critical cartography provides and creates knowledge for its audience, in which there is a whole political and rhetorical process that goes with it. Counter mapping also has its own political and rhetorical process, and like citizen cartography, it could be useful to address Richmond and Virginia’s crime from a different angle. That way, new voices could be brought in without the state telling you how to map, and it would honor voices who get shut out of maps. Maps shape our reality, and by producing maps that inadvertently reproduce inequalities, those in power benefit. With cartography becoming increasingly professionalized, counter mapping must challenge that. Overall, these maps offer a matter-of-fact approach to examining the crime in Richmond and Virginia. While I would not directly show these maps to my parents, they would notice its stereotype reaffirmations after dropping me off at school and seeing what Richmond was truly like.
References:
“The Safest and Most Dangerous Places in Richmond Metro, VA” https://crimegrade.org/safest-places-in-richmond-va-metro/
“The Safest and Most Dangerous Places in Richmond” https://crimegrade.org/safest-places-in-virginia/
Miles- I think that your map is especially interesting in parallel to the one that I chose. I think that something that you could add to your map is that the decrease in crime rates within the city probably has a lot to do with the gentrification of the city. There are many parts of the city today that look very different from 10 years ago in large part due to gentrification. While it is great that the crime rates have gone down, the displacement of people, especially those who rely on public housing is something that you could dig into. Or the government policies that affected this gentrification of the area. One of my professors said in our class a couple of weeks ago that if we come back to the city in 15 years he doesnt expect the housing project Gilpin Court to still be in Richmond.
Miles – This map and topic are both really interesting and you provided a great amount of insight through your analysis and storytelling. I appreciate how you compared the city of Richmond, which most of us are very familiar with, to the whole state of Virginia – allowing for a personal connection. The quote, “Maps shape our reality, and by producing maps that inadvertently reproduce inequalities, those in power benefit” really stood out to me from your post, as I believe it applies to a lot of the maps that we have analyzed in class and in our blog posts.
Miles,
I really liked how you structured your blog post by framing it with a personal narrative that brought you to the question of the city you inhabit. It was really interesting to see Richmond, a historically-relevant and currently-relevant capital, painted in this realistic light, where often times, people can idealize their college towns/cities. However, like Richmond, many cities have natural threats and crime rates that are unavoidable. What is interesting about your story and us overall as University of Richmond students is that we exist inside the bubble of our campus and people on this campus can be completely unaware of the realities — both brutal and beautiful — about the city that’s only 15 minutes away.