
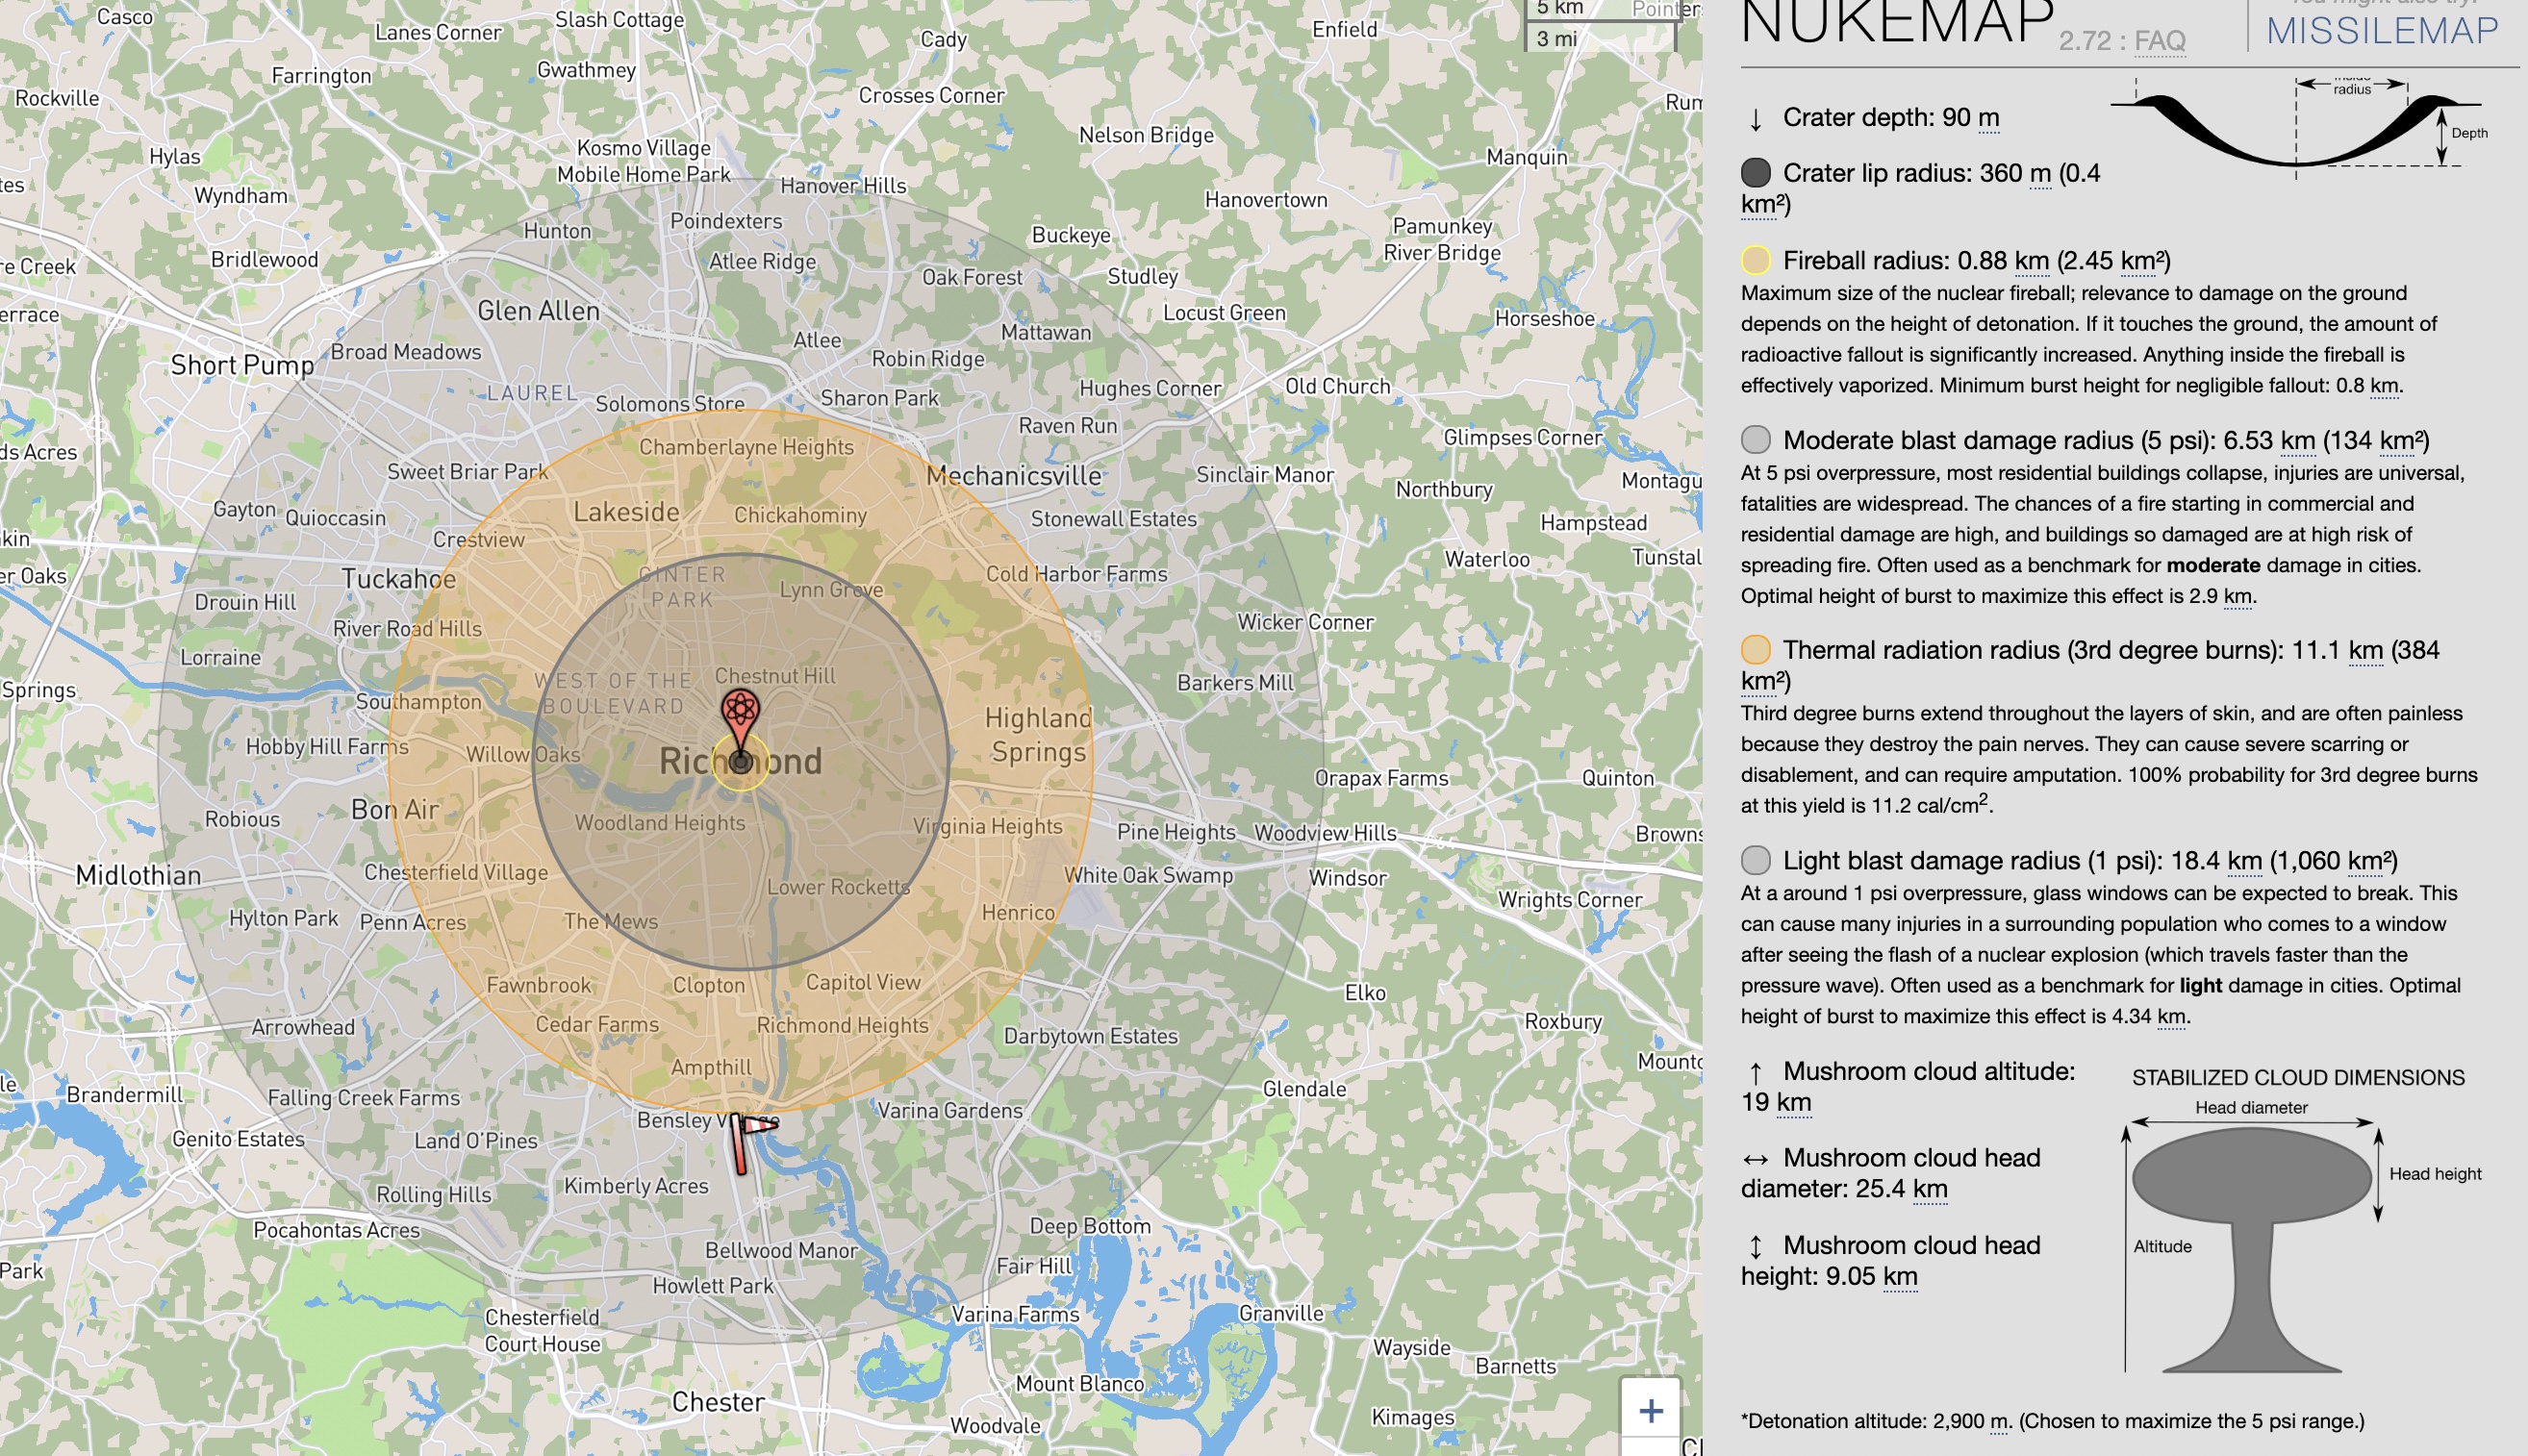
NUKEMAP in action
Some individuals have the power to launch nuclear strikes with the ability to wipe out a parcel of land the size of Texas, Alex Wellerstein has NUKEMAP. NUKEMAP is a one man project that Wellerstein built just over ten years ago that allows users to drop theoretical bombs on real world locations, with the program calculating statistics such as deaths, fallout, and injuries. Users can either select from a list of provided real-world weapons or they can create their own bomb by specifying the yield in kilotons. Wellerstein’s data hasn’t been updated to reflect Russia’s invasion of Ukraine yet, but I’d be willing to guess that searches related to Russian bombs have skyrocketed. According to Wellerstein, “pretty much every nation with an outgoing internet connection has had at least one visitor to NUKEMAP, which is a little amazing and overwhelming, even more so since NUKEMAP is in English (obviously there are ways to translate websites on the fly, but it’s an obvious impediment)” (Wellerstein, Alex). NUKEMAP reports 38 million unique visits to the site and over 220 million bombs detonated so it’s not exactly a niche program (Wellerstein, Alex).
Even with such a brief introduction, it’s not hard to see how some people could be concerned that someone built a tool that accurately measures the results from nuclear blasts, especially considering Wellerstein has “crude nuclear terrorist weapon” as a preset that users can select (“Restricted Data: The Nuclear Secrecy Blog”). Wellerstein, ever the gentleman, has aggregated some of the data from his program but has protections in place to protect privacy. While there is data on which bombs and locations are popular, Wellerstein states the program is not capable of telling “who nukes who” (“Restricted Data: The Nuclear Secrecy Blog”).
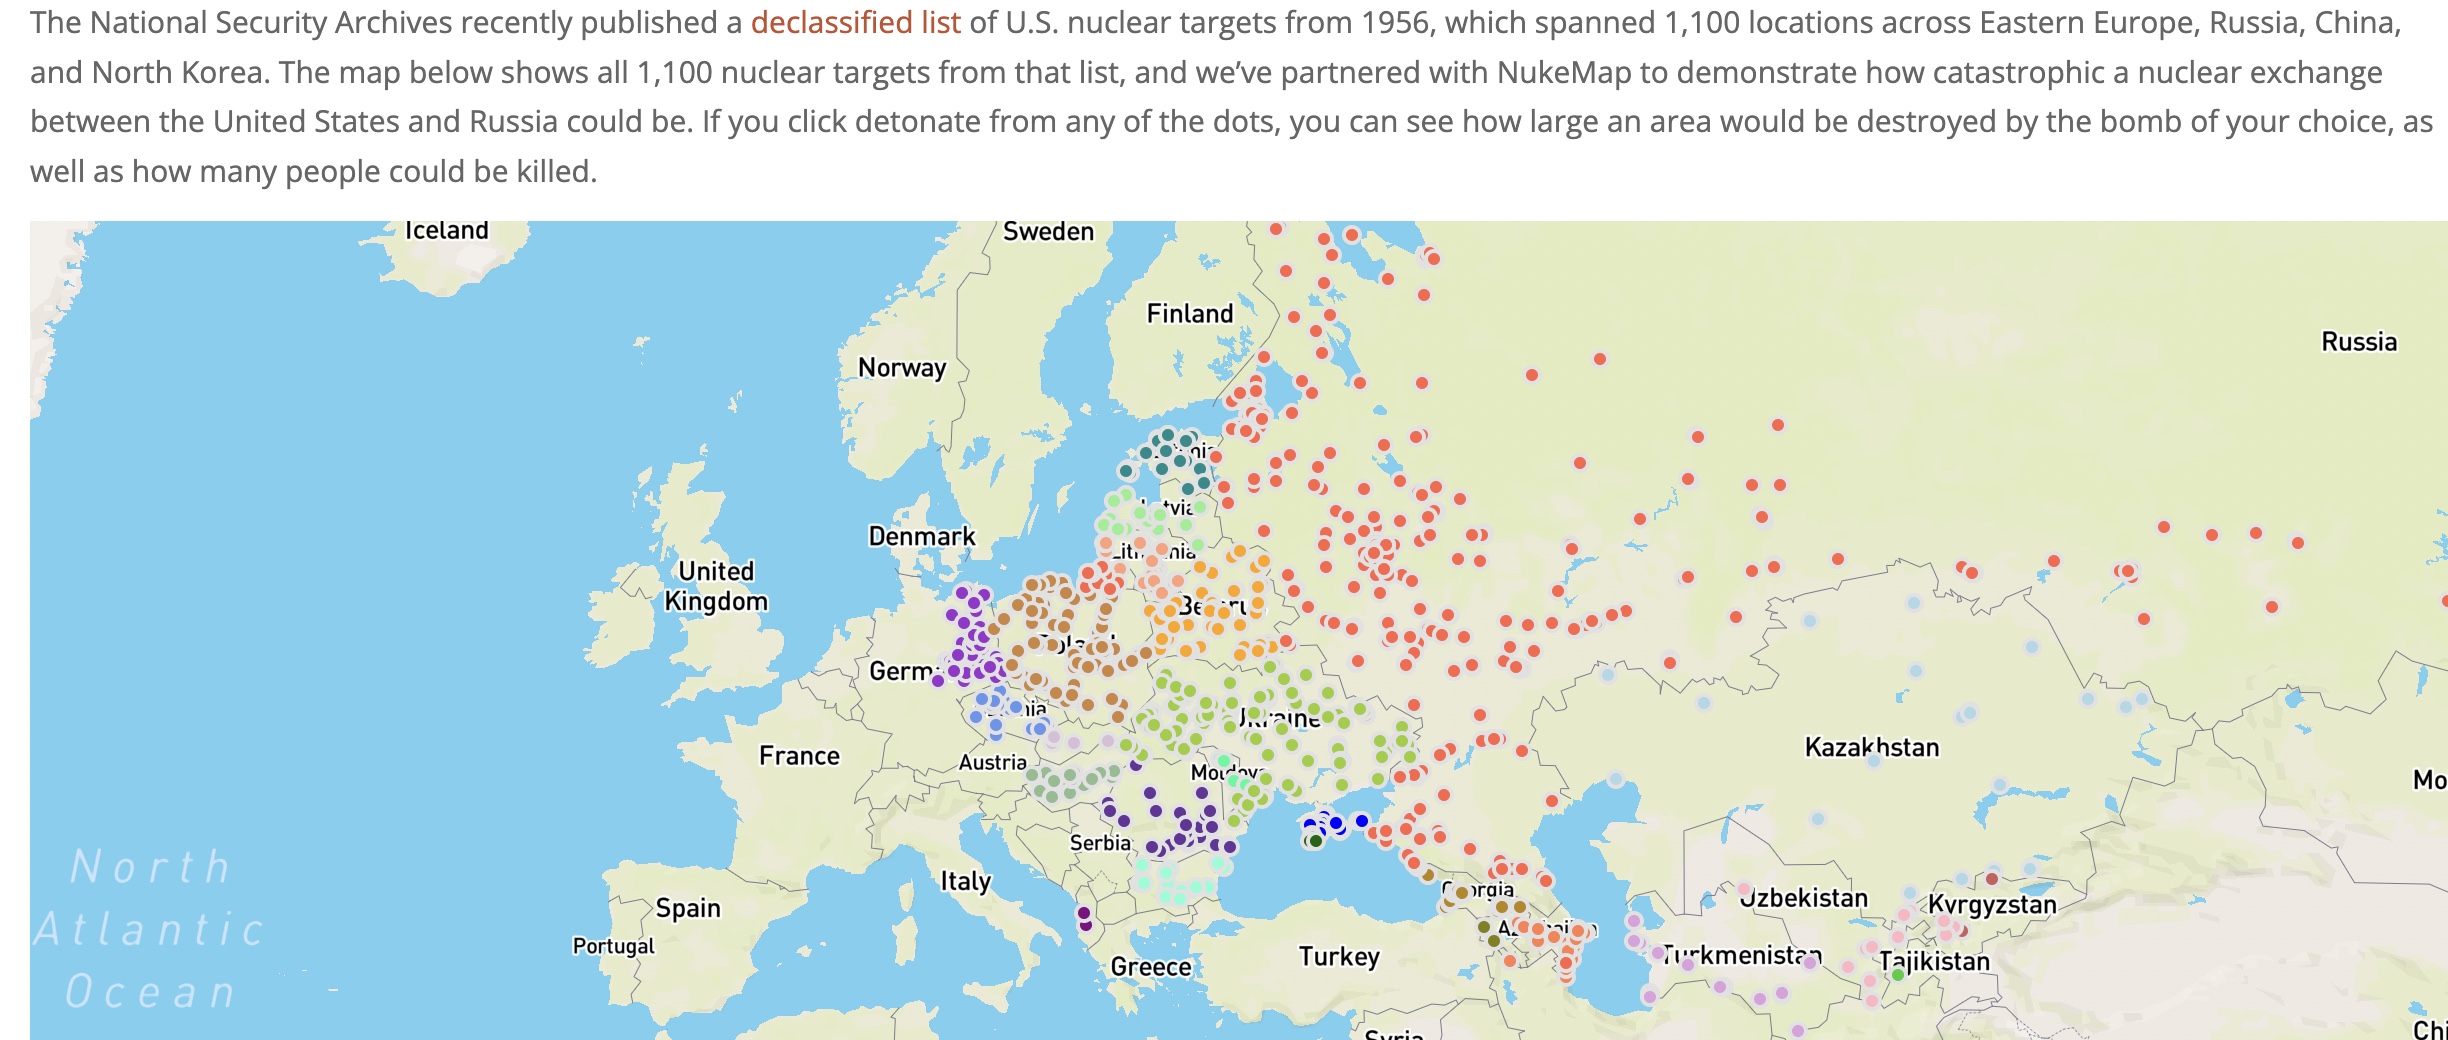
While NUKEMAP is certainly an amazing tool, it’s only one of the latest nuclear weapons maps. For example, the Future of Life Institute has created a map showing all 1100 National Security Archives’ declassified nuclear targets (“Declassified US Nuclear Targets”). Going back further in history, we are brought back to the Cuban Missile Crisis where two men had the power to potentially annihilate a significant swath of multiple countries’ populations. CNN reports of a secret ‘doomsday’ map detailing potential Cuban targets if the conflict led to nuclear strikes. Kennedy’s brother, Robert, had this to say about possible nuclear warfare: “… a surprise attack would erode if not destroy the moral position of the United States throughout the world” (“Thom Patterson, CNN.”). Although this author does not believe the United States is a moral nation, he can agree that nuclear warfare would indeed further damage the crumbling moral position of the world’s bastion of democracy.
Cold War era nuclear maps and NUKEMAP used to be quite different tools used by wholly different kinds of people. Cold War maps, at the time, were used by regular people and governments alike to determine what kinds of threats and damage they would face if tensions escalated. NUKEMAP, until Russia’s invasion of Ukraine, seems to have been used by people who were bored with some morbid curiosity and a little time on their hands. Now, however, NUKEMAP is being used as a tool just as the Cold War era maps were, for people to calculate the damages of what they believe are imminent nuclear strikes. NUKEMAP has the capability of being used as a protest tool as well thanks to the map’s powerful visual rhetoric. When a bomb is dropped on a location, the user is able to see the casualties and injuries shoot up as numerical figures and a circle appears showing the bomb’s secondary effects like radioactive fallout. The map could be used to illustrate the destructive potential of even small nuclear bombs. Given that the subject of nuclear war is often talked about in the abstract, far removed from the human element, the visuals of the map make a greater impact than words.
Looking deeper into the rhetoric of the NUKEMAP, it’s clear that Wellerstein intended to make his mapping tool user-friendly with no frills. However, no map can simply be a map. To dive into the rhetoric of cartography, we begin by examining Wellerstein’s sources. Luckily, rather than using a government or corporate source for Wellerstein’s map, he used OpenStreetMap. OpenStreetMap is an open source mapping tool focused on local knowledge and community driven members that contribute to the project to ensure that it’s functioning properly (“OpenStreetMap”). While there obviously could still be issues with open source mapping, there is considerably less risk of inaccuracies than government or corporate maps, both because of the types of people that open source mapping attracts and simply the nature of crowdsourcing.There are some pitfalls of open source mapping, however, given the nature of the concept. The goal of open source mapping is to gain as many contributors as possible, as to eliminate potential inaccuracies. An open source tool could potentially be overwhelmed with false data by hostile actors given the right circumstances. A wise man once said “the world is not in your books and maps. It’s out there” (Tolkien, J. R. R. ). Fortunately for us, open source mapping is the closest most of us can get to experiencing that.
NUKEMAP allows users to explore the effects of nuclear weapons without the obvious danger of being near the real thing. For example, if someone was worried that Washington, DC would be the target of a nuclear bomb, they could input their data and see the results. Let’s say they wanted to visualize what would happen if DC was struck by a crude nuclear weapon with a yield of 100 tons. Wellerstein’s advanced options give users the choice to explore specific PSI explosions, the effects of airburst and surface blast explosions, and the probability of burns. In other words, NUKEMAP is as close as you would ever want to get to the real thing.
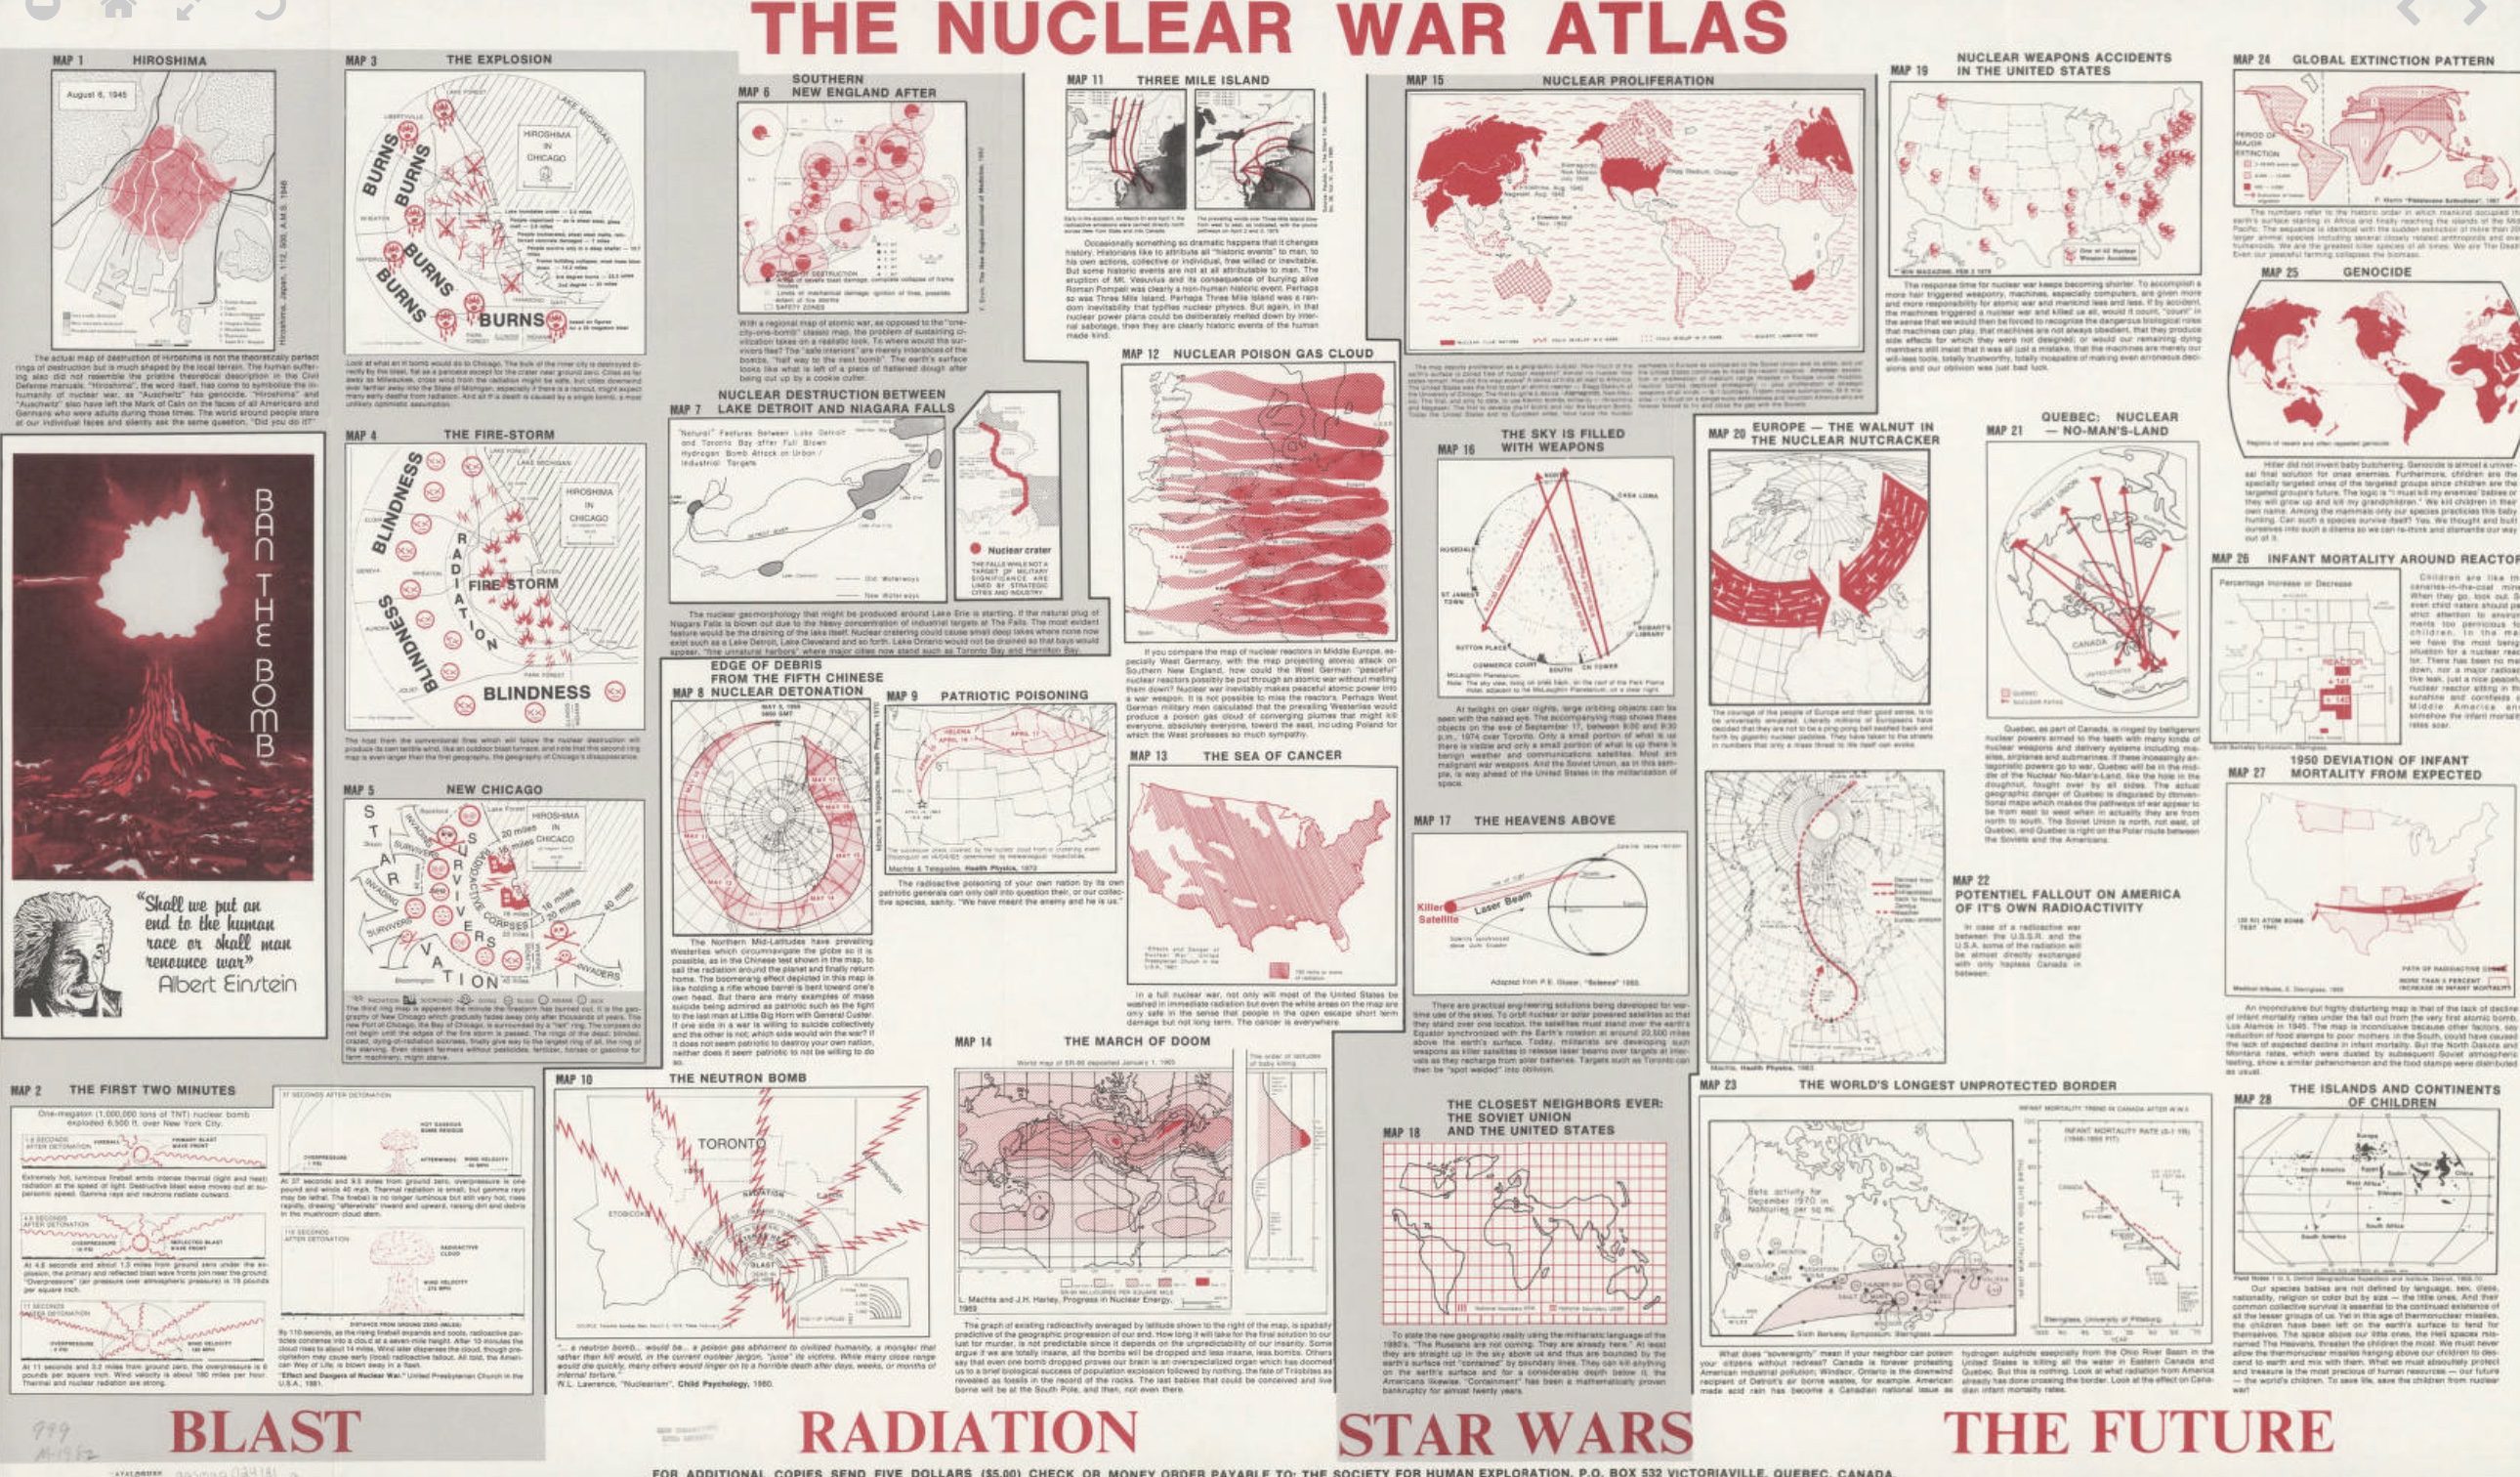
Wellerstein’s mapping tool is markedly different from the Nuclear War Atlas of 1982 published by the Society for Human Exploration (Victoriaville, Québec). The maps included in the Atlas bear striking similarities to Wellerstein’s project in the sense that the maps contained in the Atlas detail potential outcomes of nuclear strikes. However, the details included in each map are rather chilling and much more detailed than Wellerstein’s data on the aftermath of nuclear strikes. Take for example Map 13, the Sea of Cancer, which shows a projection that most of the United States will be fully irradiated if nuclear war begins (“The Nuclear War Atlas” ). For another example, direct your attention to Map 12, the Nuclear Poison Gas Cloud, in which the Atlas details that there would be no possibility of peaceful atomic power in a nuclear war (“The Nuclear War Atlas” ). That advice from 1982 seems to hold true over 40 years later as Russia has made it clear that nuclear weapons are not off the table during their invasion of Ukraine, having already captured Chernobyl (although not permanently).
All in all, Wellerstein’s mapping tool is a more advanced 21st century version of Cold War projection maps. Wellerstein’s map may have a fun flare to it but the nature of his work is as serious as the bombs that he maps. Crowdsourcing has changed the way we make maps, this fact is indisputable. No longer do people have to rely on their governments or corporations to make maps with no guarantee of accuracy. Crowdsourcing may have its issues, but it has democratized cartography and the rhetoric surrounding it, making the subject incredibly more accessible. This map is a reminder that in the digital age, bombs are just pixels on a screen until you’re the target.
Citation
“Declassified US Nuclear Targets.” n.d. Future of Life Institute. Accessed March 23, 2022. https://futureoflife.org/background/us-nuclear-targets/#nukemap.
“OpenStreetMap.” 2019. OpenStreetMap. 2019. https://www.openstreetmap.org/about.
“Restricted Data: The Nuclear Secrecy Blog.” n.d. Restricted Data: The Nuclear Secrecy Blog. Accessed March 23, 2022. http://blog.nuclearsecrecy.com/.
“The Nuclear War Atlas” n.d. Collections.lib.uwm.edu. Accessed March 23, 2022. https://collections.lib.uwm.edu/digital/collection/agdm/id/15370.
Thom Patterson, CNN. 2018. “How the Kennedys Handled the Cuban Missile Crisis.” CNN. April 6, 2018. https://www.cnn.com/2018/04/06/us/jfk-cuban-missile-crisis-map-auction/index.html.
Tolkien, J. R. R. 2012. The Hobbit. London, England: HarperCollins.
Wellerstein, Alex. 2006. “NUKEMAP by Alex Wellerstein.” Nuclearsecrecy.com. 2006. https://nuclearsecrecy.com/nukemap/.