Lena Lee – project 1
Lena Lee
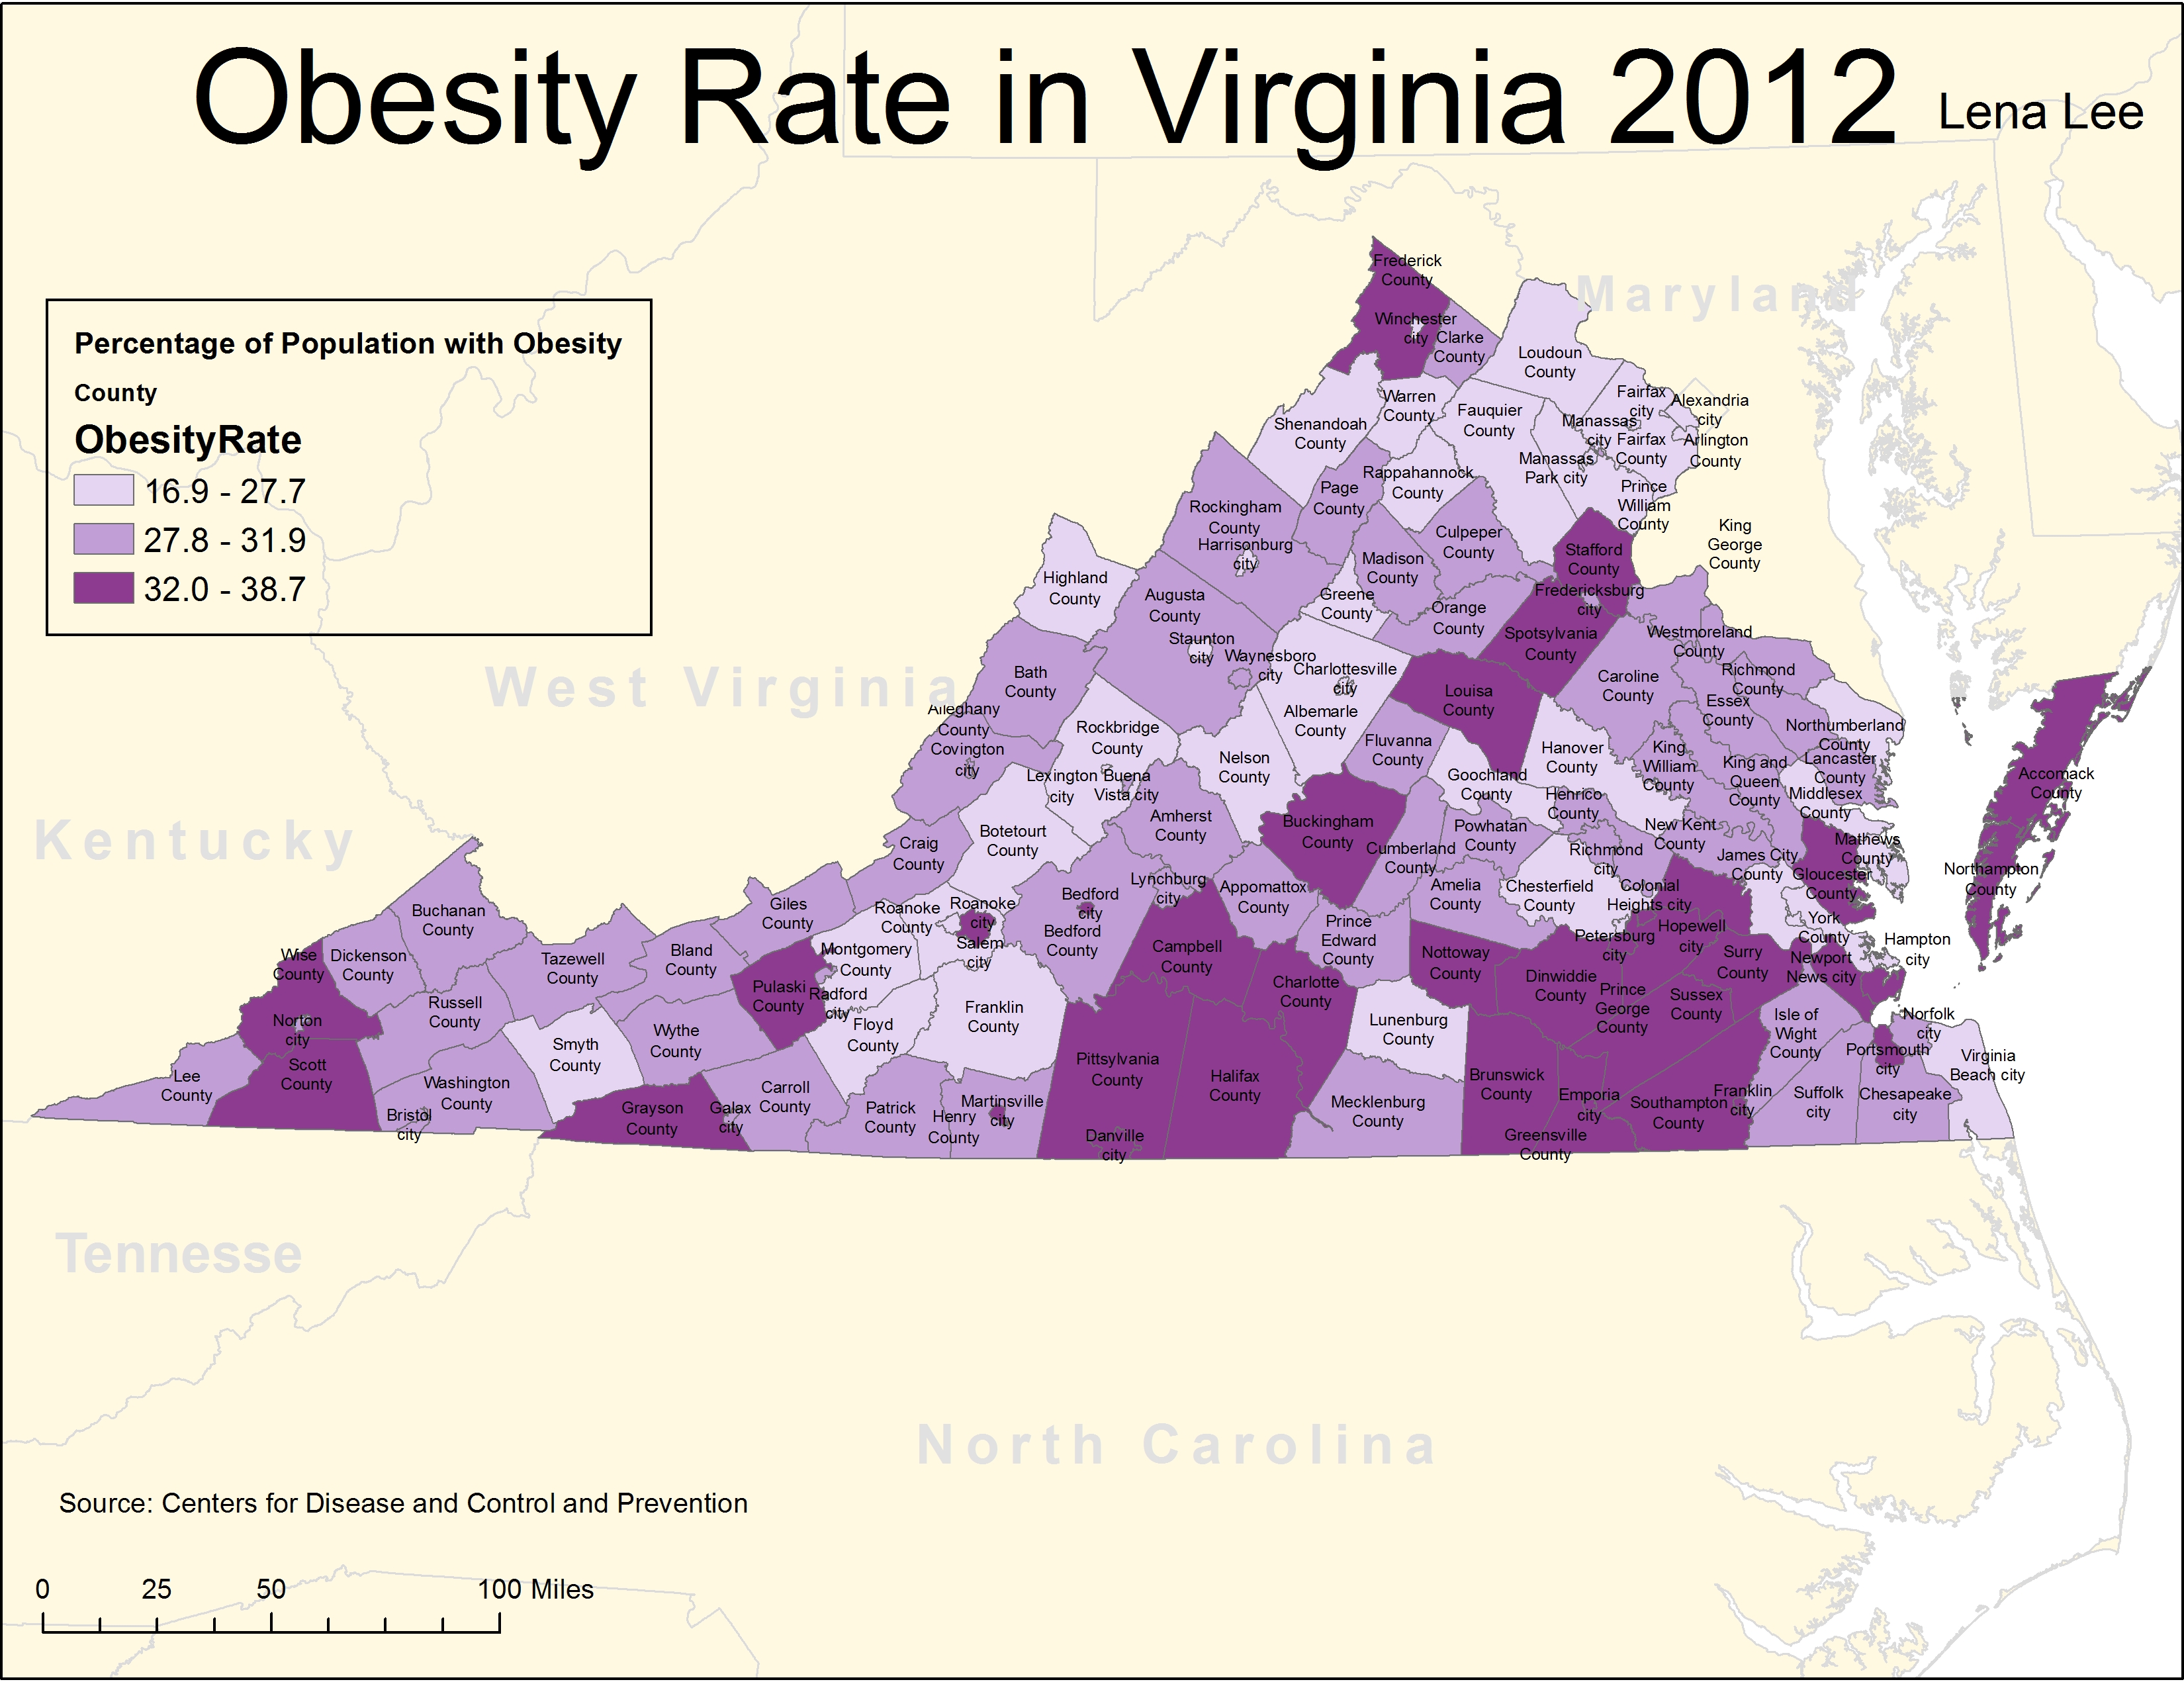
I made a map of obesity rates(in all age groups) in the State of Virginia. The data is from CDC and is divided by counties. The darker the shade of the purple is, the more obese people there are in a county. (the data is from 2012) I did not want the map to be red because of the negative connotation it might carry regarding obesity. Each county and city is labeled because it makes it easy to see which parts of the state have obesity problems. This data is important because certain areas have the tendency to have higher percentage of the problems and by mapping it, it may show what needs to be fixed to decrease the percentage of obesity. It will also be interesting to compare which areas have obesity, asthma, diabetes, etc. and how those conditions and diseases are related to the rate of poverty in the area. It is said that they are related because the poor neighborhood areas tend to have higher rates of those conditions listed above.