http://urichmond.maps.arcgis.com/apps/MapTour/index.html?appid=7dd84ee970584fbc8a3e51cce60ab01b
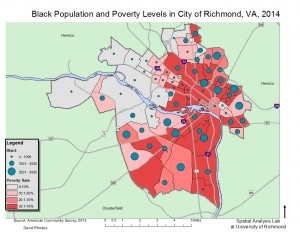
For my map project I would like to assist the Bonner Center for Civic Engagement and work with their City of Richmond poverty maps. After getting in contact with Olivia Mobayed, I looked through a large number of their maps in order to pick a map to help recreate. I have found a map titled “Black Population and Richmond Poverty Rate, 2014”. I chose this map specifically because I am interested in how race interacts with overall poverty in Richmond. Furthermore, the dots that represent the black population who are in poverty are red and are layered on top of a map that uses shades of red to show the levels of poverty in the different regions of Richmond. This map is difficult to read due to the similarity of the colors representing different data that is overlaid on top of each other. I am hoping to create a new map with this data to display the data in a more revealing manner.
There is a ton to learn about maps and the weight that they carry, especially in military negotiation. I never imagined that a map could create so much tension and elongate a negotiation as it was described by Motro. Before reading this article, I assumed maps were just supplementary information in a negotiation process but this article opened my eyes to their value and importance in military negotiations. The use of maps as a negotiating tool is incredibly important and must be used wisely if it is to benefit the negotiation process. By manipulating maps in order to convey certain information, the cartographers can either expedite or elongate the process!
My name is David Rhodes and I am a junior Accounting major from Norcross, Georgia. While this course does not exactly line up with my major, I feel as though the skills and tools that I will build in this course are incredibly valuable. Regardless of where I end up after college, the skills and understanding of GIS will serve me well and for this reason I am very excited to take this course.
During my recent summer study abroad experience, I was introduced to the ARCGIS system. During the trip, we traveled all around the east Australian coastline. During our travels we would periodically use GPS devices to record our latitude and longitude as well as other details about the area such as elevation. After recording all of these various points, we then plotted them all into ARCGIS and made a map of our entire trip and used the features in the program in order to create an interactive learning experience. I really enjoyed the final product that I could show off and see my accomplishment. It was really cool to be able to create this map and then be able to compare different locations in a seamless and attractive map. I was also surprised with how user friendly ARCGIS was and it gave me confidence for other GIS programs.
I am hoping this class teaches me new skills and tools that could potentially benefit my education here at the University of Richmond. Just yesterday I was in my Urban Economics class and we were talking about how useful GIS is in an Urban Economists daily life. My professor is able to use GIS to plot “food deserts” and types of stores in different locations. Through the use of GIS, projects and presentations are incredibly accessible and attractive for my professor. Before sitting in my Urban Economics class I was wondering if the skills I will learn in this class will ever benefit me but after yesterday, I am convinced now more than ever, that even me, an accounting major, can benefit greatly from learning such a valuable skill like GIS.
Welcome to blog.richmond.edu. This is your first post. Edit or delete it, then start blogging!


