Ken Hoffman Maps- Vacant Housing and Rainy Days

This is a map that shows the percent of vacant housing units in counties throughout the United States. The darker the yellow, the higher the percentage of vacant housing units in that particular county. As you can see, the percent of vacant houses is higher in the western half of the United States.
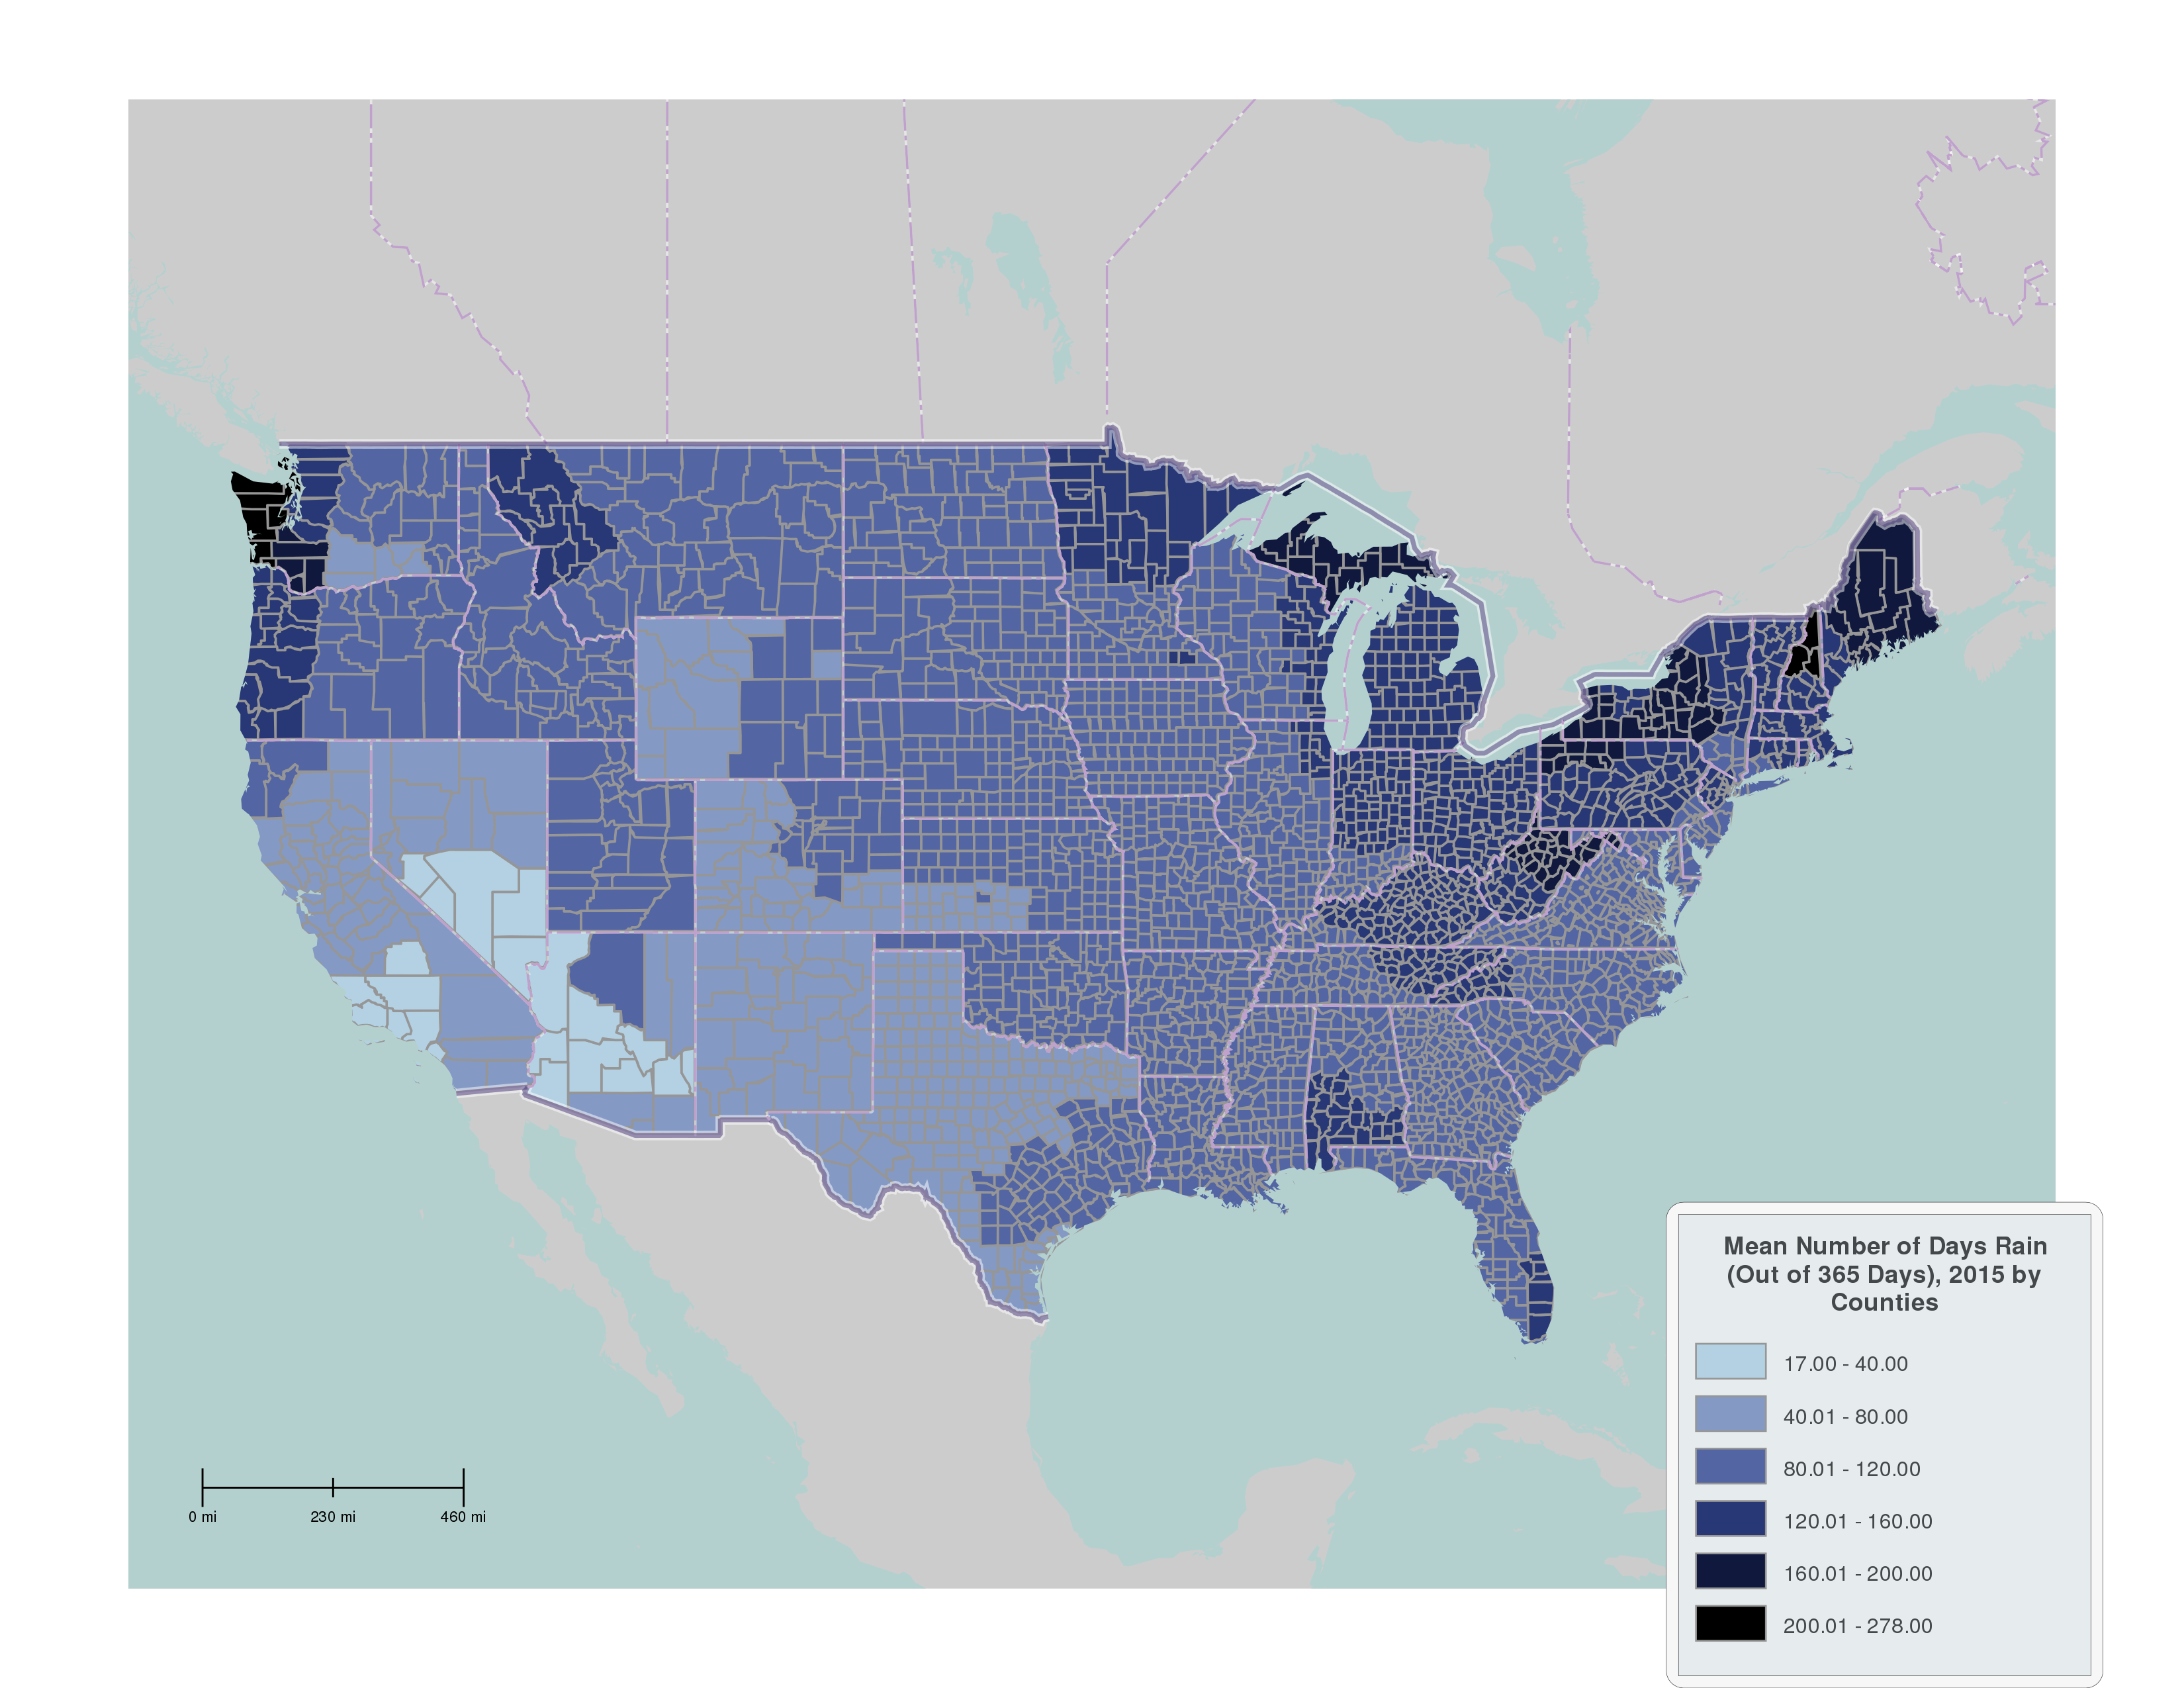
This map’s purpose is to show the mean number of days it rains in parts throughout the United States. You can see through this map that it rains the most in the northwest and northeast. It rains in Arizona and New Mexico the least.