
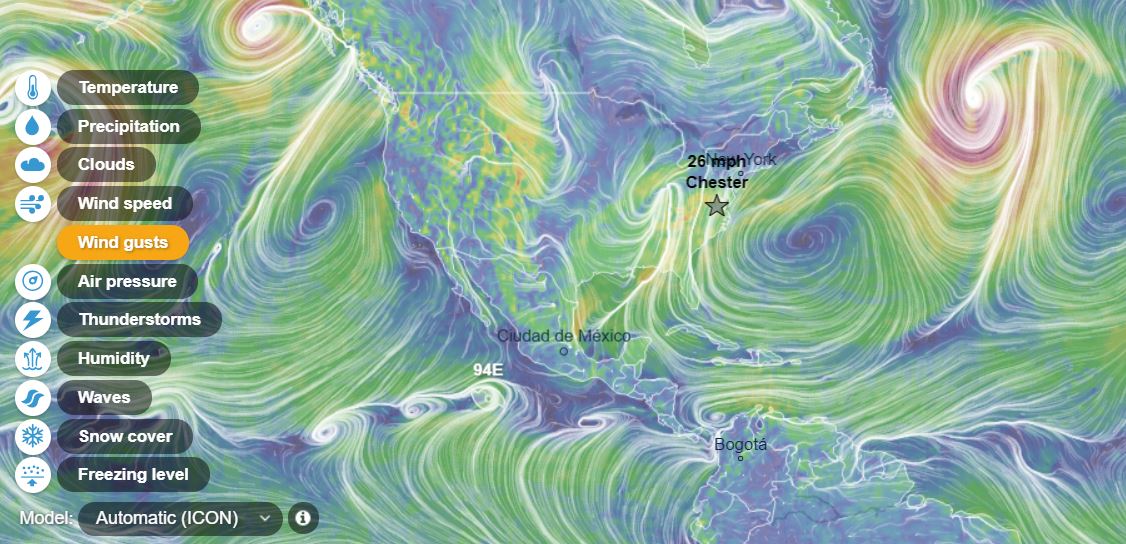
Ventusky is one of my favorite geovisualization websites. Users can select any of numerous physical phenomenon to view in near realtime, from wind gusts to surface temperatures to cloud cover, all with variables for time and altitude. This website serves as an apt companion for our study of the atmosphere and hydrosphere. Most notably, the tradewinds around the equator are often obviously evident, as well as Hadley cells and the acceleration from high to low pressure areas. Also of note, the coriolis effect can be seen if the correct settings are selected.
This is a cool website because you can view certain geography attributes at a local or global scale such as thunderstorms or snow cover. My favorite is seeing the different wave heights. However, this website may be somewhat difficult for people to use if they’ve never taken a geography class before or if they haven’t learned certain terms.
This website is so cool! What a great visualization of all of the parts of the atmosphere operating simultaneously. Definitely helpful to understanding some of the concepts we’ve talked about in past units, and applying them as we see them in action in these visualizations. This site is easy to navigate too. Thanks for posting!!
This website is so cool! I like how you are able to click on any location and discover the air pressure, clouds, and wind speed. It is also interesting that Ventusky can provide this information for future times in the day at various speeds and color schemes. This website could also be useful as a visualization of coriolis effect. Ventusky would be a great website to use during the atmosphere unit.