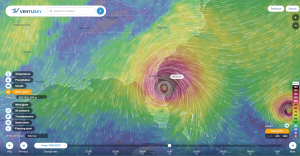
Have you ever looked for a free online tool aimed at improving awareness about meteorological events in our atmosphere? Look no further than Ventusky.com.
After devastating several Caribbean countries like Haiti, Hurricane Matthew (pictured above 2016.10.07) followed its predicted path along the coast of the south-eastern seaboard of the United States. Hurricane Matthew was a category 4 hurricane, meaning just the wind alone has the potential to rip trees out of the ground and even level entire buildings. The worst part of Hurricane Matthew was the storm surge which is caused by high winds pushing water inland. Widespread flooding along the coast of the eastern seaboard is the result of storm surge. The danger during a category 4 hurricane is real, which is why several National Parks, including the Everglades National Park closed for the duration of the storm.
On Ventusky.com, anyone can view a multitude of different atmospheric or hydrospheric measurements of any desired location on Earth. I used the webpage to track and view the wind speed and gusts, air pressure readings, and precipitation levels during Hurricane Matthew. I encourage any other amateur geographer out there to utilize this amazing tool to track the next storm in your area.


I found this website extremely interesting and useful for looking at different aspects of the weather such as precipitation, clouds and windspeed. I also thought it was really interesting that the map could be manipulated so much so that it was extremely interactive. Ventusky.com seems very similar to wunderground.com!
I thought this website was fascinating! It was so interesting to manipulate the different tools to visualize different weather patters across the world. I particularly liked that global air circulation patterns where displayed consistently, regardless of which tool was being used. This made it very easy to understand how weather moves. It was also interesting to look at the VA area and compare the map to the weather we are currently experiencing on campus; I thought it was very accurate!