Post by Andrew Loesch ’17
Hey all! My name is Andrew and I am a rising junior studying environmental studies and geography at the university. This summer I’ve been fortunate enough to have the opportunity to work with Dr. Todd Lookingbill and Professor Kimberley Klinker in the Spatial Analysis Lab this summer via the S4 internship. Since we’ve been gone for a little while, I wanted to give all of you a peek into what exciting things I’ve been up to in the SAL during the past couple of weeks. Working in collaboration with Dr. John Scrivani, we’ve been preparing for the launch of the GARDEN Project at the University of Richmond. The Geospatial Archive Resource and Data Exchange Network (GARDEN) Project is an initiative designed to make redundant sources of Virginia Base Mapping Program (VBMP) aerial photography to increase its availability for state agencies, local governments, and the public. In addition to making aerial photography more accessible, the University of Richmond is preparing to host 2010 United States Census Data with the Virginia Geographic Information Network (VGIN). Alongside other leading universities in the Commonwealth of Virginia including Virginia Tech, Virginia Commonwealth University, and the College of William and Mary, the University of Richmond will serve as one of many nodes designed to mirror aerial photography and census datasets to increase their redundancy and accessibility in Virginia. Aside from preparations geared towards beginning hosting services at the university, we’ve been working on a couple projects to compliment the launch of the GARDEN node at the University of Richmond.
Our first GARDEN-related project might, at first glance, look like a simple quality of life improvement for the Spatial Analysis Lab. While collaborating with VGIN we discovered that US Census data does not contain metadata. Subsequently, several crucial facets of attributes in the dataset are left unexplained. Names for attribute fields, for example, may not clearly display what corresponding values represent. Fields contrived via calculations, such as density, do not include what values the calculations involved, the corresponding equation, or the definition of the result. Further, specific definitions associated with race and ethnicity are not included with the data. This may lead to confusion related to specific attributes and future analysis of the census data. To improve clarity alongside accessibility, we’ve created several tiers of metadata to attach to census data. These documents contain definitions and explanations from US Census Bureau documents as well as information for points of contact at the University of Richmond.
The second project serves as an example of potential analyses using data made accessible through the GARDEN Project. Taking a look at the issue of segregation in the city of Richmond, we’ve begun to assess the change in African American and White populations in the city of Richmond between 1950 and the present using 2010 US census data. At first glance the process for analyzing and comparing racial dynamics between 1950 and 2010 is simple: assess mean populations of both black and white populations by census tract and identify areas with a disproportionate population of either black or white individuals. Historical alterations to the city of Richmond, however, complicate the process by a considerable amount. Annexations of land belonging to Chesterfield County made by the city of Richmond in 1970 create especially tricky problems as the land belonging to the city changes by a significant amount between 1950 and 2010. The approach we chose solves both this issue and other alterations made to census tracts between the years of 1950 and 2010. Using area weighted areal interpolation, we aggregated 2010 populations of individuals identifying as black or white and placed them within 1950 census tract borders. After identifying areas with disproportionately black or white populations within the city of Richmond in 1950 and 2010, indices of dissimilarity were calculated for each time period. An index of dissimilarity serves as a measurement, represented by a percentage between 0 and 100, indicative of how segregated a population within a geographic region. The measurement involves two racial groups and displays the likelihood that two individuals, selected at random, will be of the same racial identity. Higher values indicate that the two individuals selected at random are more likely to belong to the same racial group whereas lesser values represent a likelihood that the two selected individuals will belong to different races. As a result, higher values indicate more segregated populations.
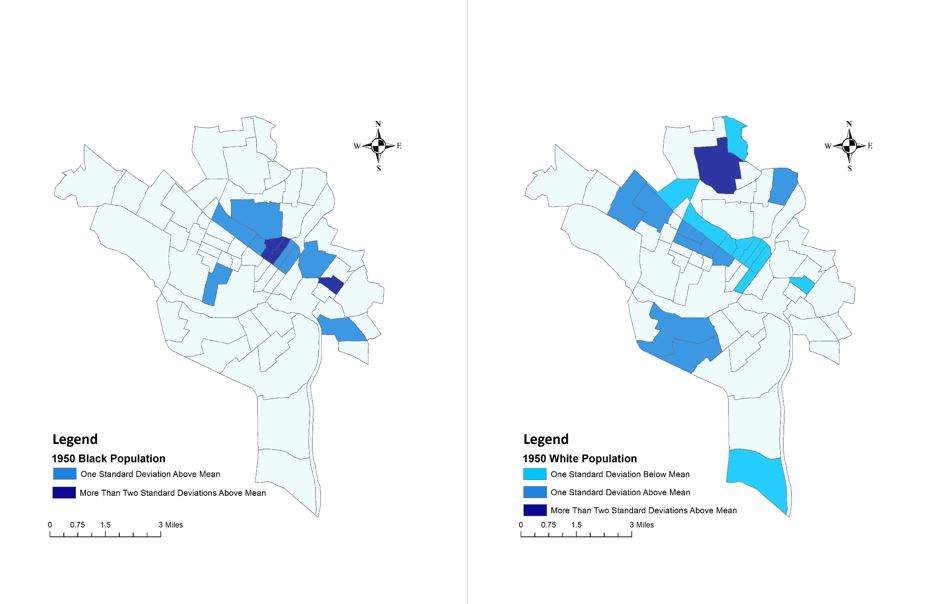
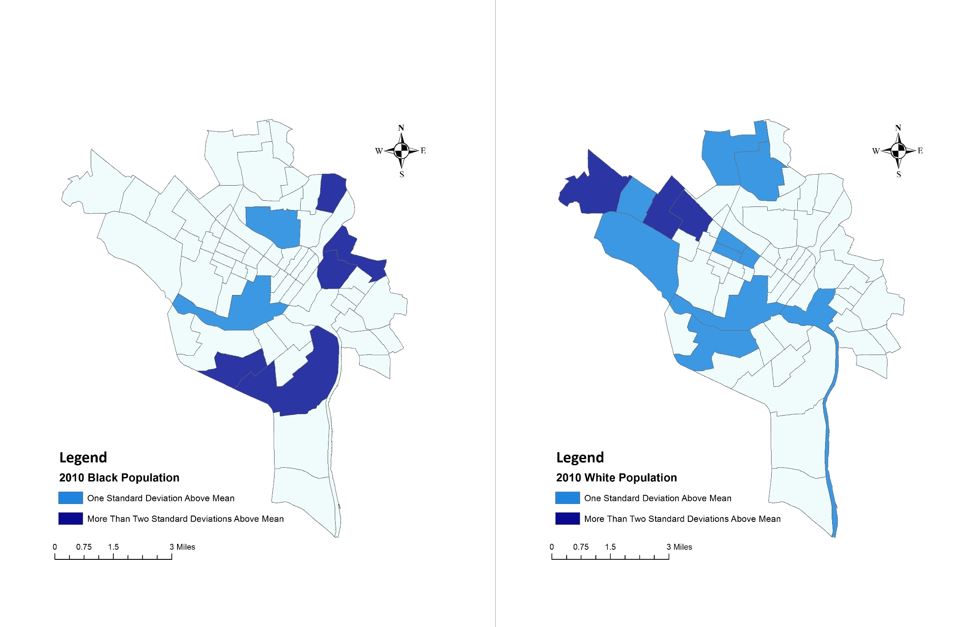
The indices of dissimilarity indicate an improvement between the years of 1950 and 2010, as there is an approximately eight percent difference between the values. However, the black and white populations in the city of Richmond are still highly segregated according to this measurement of population integration as the index of dissimilarity using 2010 US census data is approximately 63%. However, this is only a single application of the census data. With the GARDEN Project improving accessibility to these sets of data in the Commonwealth of Virginia, the possibilities for spatial analyses of population, racial, and ethnic dynamics across the United States appear endless.


